
Videos
Select a random sample of 15 individuals and test one or more of the hypotheses in Exercise 1 by using the t test. Use α = 0.05.
The Data Bank is found in Appendix B, or on the World Wide Web by following links from www.mhhe.com/math/stats/bluman/
1. From the Data Bank, select a random sample of at least 30 individuals, and test one or more of the following hypotheses by using the z test. Use α = 0.05.
a. For serum cholesterol, H0: μ = 220 milligram percent (mg%). Use σ = 5.
b. For systolic pressure, H0: μ = 120 millimeters of mercury (mm Hg). Use σ = 13.
c. For IQ, H0: μ = 100. Use σ = 15.
d. For sodium level, H0: μ = 140 milliequivalents per liter (mEq/l). Use σ = 6.
a.
To test: The claim that
Answer to Problem 2DA
The conclusion is that there is sufficient evidence to infer that the average serum cholesterol level is 220 milligram percent (mg%).
Explanation of Solution
Answer will vary. One of the possible answers is given below:
Given info:
Claim:
Calculation:
State the null and alternative hypotheses:
Null hypothesis:
Alternative hypothesis:
Test statistic value and P-value:
Software procedure:
Step by step procedure to obtain the test value using the MINITAB software:
- Choose Stat > Basic Statistics > 1-Sample t.
- In Samples in Column, enter the column of Serum cholesterol.
- In Perform hypothesis test, enter the test mean as 220.
- Check Options; enter Confidence level as 95%.
- Choose not equal in alternative.
- Click OK in all dialogue boxes.
Output using the MINITAB software is given below:
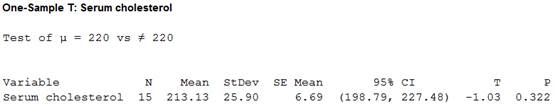
From the output, the test value is –1.03 and the P-value is 0.322.
Make the Decision:
Decision rule:
If
If
Here, the P-value is greater than the level of significance.
That is,
By the decision rule, the null hypothesis is not rejected.
Thus, the decision is “fail to reject the null hypothesis”.
Summarize the result:
There is sufficient evidence to infer that the average serum cholesterol level is 220 milligram percent (mg%).
b.
To test: The claim that
Answer to Problem 2DA
The conclusion is that there is sufficient evidence to infer that the average systolic pressure is differs from 120 millimeters of mercury (mm Hg).
Explanation of Solution
Given info:
Claim:
Calculation:
State the null and alternative hypotheses:
Null hypothesis:
Alternative hypothesis:
Test statistic value and P-value:
Software procedure:
Step by step procedure to obtain the test value using the MINITAB software:
- Choose Stat > Basic Statistics > 1-Sample t.
- In Samples in Column, enter the column of Systolic pressure.
- In Perform hypothesis test, enter the test mean as 120.
- Check Options; enter Confidence level as 95%.
- Choose not equal in alternative.
- Click OK in all dialogue boxes.
Output using the MINITAB software is given below:
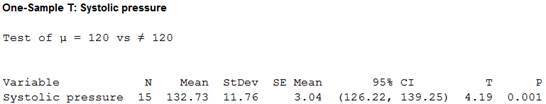
From the output, the test value is 4.19 and the P-value is 0.001.
Make the Decision:
Here, the P-value is lesser than the level of significance.
That is,
By the decision rule, the null hypothesis is rejected.
Thus, the decision is “reject the null hypothesis”.
Summarize the result:
There is sufficient evidence to infer that the average systolic pressure is differs from 120 millimetres of mercury (mm Hg).
c.
To test: The claim that
Answer to Problem 2DA
The conclusion is that there is sufficient evidence to infer that the average IQ score is differs from 100.
Explanation of Solution
Given info:
Claim:
Calculation:
State the null and alternative hypotheses:
Null hypothesis:
Alternative hypothesis:
Test statistic value and P-value:
Software procedure:
Step by step procedure to obtain the test value using the MINITAB software:
- Choose Stat > Basic Statistics > 1-Sample t.
- In Samples in Column, enter the column of IQ.
- In Perform hypothesis test, enter the test mean as 100.
- Check Options; enter Confidence level as 95%.
- Choose not equal in alternative.
- Click OK in all dialogue boxes.
Output using the MINITAB software is given below:
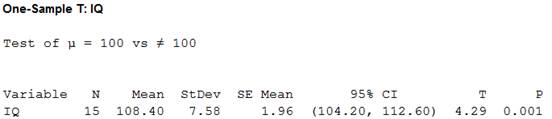
From the output, the test value is 4.29 and the P-value is 0.000.
Make the Decision:
Here, the P-value is lesser than the level of significance.
That is,
By the decision rule, the null hypothesis is rejected.
Thus, the decision is “reject the null hypothesis”.
Summarize the result:
There is sufficient evidence to infer that the average IQ score is differs from 100.
d.
To test: The claim that
Answer to Problem 2DA
The conclusion is that there is sufficient evidence to infer that the average sodium level is 140.
Explanation of Solution
Given info:
Claim:
Calculation:
State the null and alternative hypotheses:
Null hypothesis:
Alternative hypothesis:
Test statistic value and P-value:
Software procedure:
Step by step procedure to obtain the test value using the MINITAB software:
- Choose Stat > Basic Statistics > 1-Sample t.
- In Samples in Column, enter the column of Sodium level.
- In Perform hypothesis test, enter the test mean as 140.
- Check Options; enter Confidence level as 95%.
- Choose not equal in alternative.
- Click OK in all dialogue boxes.
Output using the MINITAB software is given below:
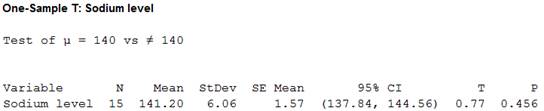
From the output, the test value is 0.77 and the P-value is 0.456.
Make the Decision:
Here, the P-value is greater than the level of significance.
That is,
By the decision rule, the null hypothesis is not rejected.
Thus, the decision is “fail to reject the null hypothesis”.
Summarize the result:
There is sufficient evidence to infer that the average sodium level is 140.
Want to see more full solutions like this?
Chapter 8 Solutions
ALEKS 360 ELEM STATISTICS


- 9. The concentration function of a random variable X is defined as Qx(h) = sup P(x ≤ X ≤x+h), h>0. Show that, if X and Y are independent random variables, then Qx+y (h) min{Qx(h). Qr (h)).arrow_forward10. Prove that, if (t)=1+0(12) as asf->> O is a characteristic function, then p = 1.arrow_forward9. The concentration function of a random variable X is defined as Qx(h) sup P(x ≤x≤x+h), h>0. (b) Is it true that Qx(ah) =aQx (h)?arrow_forward
- 3. Let X1, X2,..., X, be independent, Exp(1)-distributed random variables, and set V₁₁ = max Xk and W₁ = X₁+x+x+ Isk≤narrow_forward7. Consider the function (t)=(1+|t|)e, ER. (a) Prove that is a characteristic function. (b) Prove that the corresponding distribution is absolutely continuous. (c) Prove, departing from itself, that the distribution has finite mean and variance. (d) Prove, without computation, that the mean equals 0. (e) Compute the density.arrow_forward1. Show, by using characteristic, or moment generating functions, that if fx(x) = ½ex, -∞0 < x < ∞, then XY₁ - Y2, where Y₁ and Y2 are independent, exponentially distributed random variables.arrow_forward
- 1. Show, by using characteristic, or moment generating functions, that if 1 fx(x): x) = ½exarrow_forward1990) 02-02 50% mesob berceus +7 What's the probability of getting more than 1 head on 10 flips of a fair coin?arrow_forward9. The concentration function of a random variable X is defined as Qx(h) sup P(x≤x≤x+h), h>0. = x (a) Show that Qx+b(h) = Qx(h).arrow_forward
- Suppose that you buy a lottery ticket, and you have to pick six numbers from 1 through 50 (repetitions allowed). Which combination is more likely to win: 13, 48, 17, 22, 6, 39 or 1, 2, 3, 4, 5, 6? barrow_forward2 Make a histogram from this data set of test scores: 72, 79, 81, 80, 63, 62, 89, 99, 50, 78, 87, 97, 55, 69, 97, 87, 88, 99, 76, 78, 65, 77, 88, 90, and 81. Would a pie chart be appropriate for this data? ganizing Quantitative Data: Charts and Graphs 45arrow_forward10 Meteorologists use computer models to predict when and where a hurricane will hit shore. Suppose they predict that hurricane Stat has a 20 percent chance of hitting the East Coast. a. On what info are the meteorologists basing this prediction? b. Why is this prediction harder to make than your chance of getting a head on your next coin toss? U anoiaarrow_forward
 College Algebra (MindTap Course List)AlgebraISBN:9781305652231Author:R. David Gustafson, Jeff HughesPublisher:Cengage Learning
 Holt Mcdougal Larson Pre-algebra: Student Edition...AlgebraISBN:9780547587776Author:HOLT MCDOUGALPublisher:HOLT MCDOUGAL
 Glencoe Algebra 1, Student Edition, 9780079039897...AlgebraISBN:9780079039897Author:CarterPublisher:McGraw Hill