
Effect on cycle length due to
Answer to Problem 18P
Cycle length value increases with
Explanation of Solution
Given data:
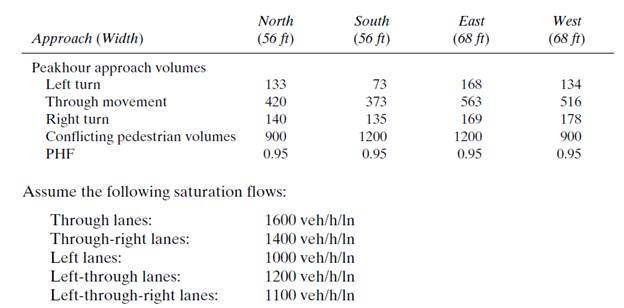
Calculation:
Evaluating equivalent hourly flow −
Similarly, evaluating equivalent hourly flow for all traffic movements −
Table 1
| Approach (width) | N (56ft) | S (56ft) | E (68ft) | W (68ft) |
| Left turn | 133/0.95 = 140 | 73/0.95 = 77 | 168/0.95 = 177 | 134/0.95 = 142 |
| Through movement | 443 | 393 | 593 | 544 |
| Right turn | 148 | 143 | 178 | 188 |
| Conflicting pedestrian volume | 948 | 1264 | 1264 | 948 |
Assuming lane configuration as one dedicated left turn and combined through and right lane −
Table 2
| Approach | N | S | E | W |
| Left | 140 | 77 | 177 | 142 |
| Through + Right | 589 (442+147) | 535 (393+178) | 771 (593+178) | 730 (543+187) |
Assume a phase scheme and find critical ratios(
Table 3
| - | Phase lE-W (Left) | Phase llE-W (Through) | Phase lllN-S (Left) | Phase lVN-S (Through) |
| 177 | 771 | 140 | 589 | |
| 1000 | 3000 (1600+1400) | 1000 | 3000 (1600+1400) | |
| 0.177 | 0.257 | 0.140 | 0.196 |
Sum of critical ratios −
Assuming lost time per phase (
So, Total lost time −
Now, determining the optimum cycle length −
(Cycle lengths are generally multiple of
Finding Total effective green time −
Effective time for phase
For Phase l
(Assuming yellow time as
For Phase ll
For Phase lll
For Phase lV
Table 4
| Phase | Allocated green & yellow time (in sec) |
Total cycle length
Green time required for pedestrian crossing can be calculated as following formula:
(Assuming the crosswalk width as
Where,
Calculating
Calculating minimum time required (
Minimum time required for N approach (
Minimum time required for S approach (
Minimum time required for E approach (
Minimum time required for W approach (
Table 5
| Phase | Minimum green time (in sec) |
Sum of green and yellow time is given by,
Total cycle length is given by,
Now increasing the pedestrian volume with
Table 6
| New conflicting pedestrian volume | 1138 | 1517 | 1517 | 1138 |
According to the new pedestrian volume calculating minimum time required by pedestrian for each approach:
Calculating
Calculating new minimum time required (
Minimum time required for N approach (
Minimum time required for S approach (
Minimum time required for E approach (
Minimum time required for W approach (
Comparing the
Selecting greater values in between both
Table 7
| Phase | New minimum green time (in sec) |
Sum of green and yellow time is given by,
Total new cycle length is given by,
Conclusion:
With using pedestrian volume flow rate
Want to see more full solutions like this?
Chapter 8 Solutions
Traffic And Highway Engineering

- E:/school%20pack/BENG%202/EG231/STATICS/LECTURE%20NOTES/PRACTICE%20QUESTIONS/EG%20231%20Chap-5%20Practice%20Que PDF 豆豆豆豆豆豆 aw V Aa | Ask Copilot - + 4 of 8 D 3. Calculate the y-coordinate of the centroid of the shaded area. 74 mm y 3232 mm mm DELL 32 mm -x F1 F2 F3 F4 F5 F6 F7 F8 F9 prt sc F10 home end F11 F 2 W E3 $ 4 € 95 % & 6 7 8 * 00 R T Y כ 9 O Parrow_forward*8-60. The 2-in.-diameter rod is subjected to the forces shown. Determine the state of stress at point B, and show the results on a differential element located at this point. Probs. 8-59/60 B 8 in. 600 lb 12 in. 500 lb 800 lbarrow_forwardfind SFD and BMD by using slope deflection methodarrow_forward
- The following relates to Problems 4 and 5. Christchurch, New Zealand experienced a major earthquake on February 22, 2011. It destroyed 100,000 homes. Data were collected on a sample of 300 damaged homes. These data are saved in the file called CIEG315 Homework 4 data.xlsx, which is available on Canvas under Files. A subset of the data is shown in the accompanying table. Two of the variables are qualitative in nature: Wall construction and roof construction. Two of the variables are quantitative: (1) Peak ground acceleration (PGA), a measure of the intensity of ground shaking that the home experienced in the earthquake (in units of acceleration of gravity, g); (2) Damage, which indicates the amount of damage experienced in the earthquake in New Zealand dollars; and (3) Building value, the pre-earthquake value of the home in New Zealand dollars. PGA (g) Damage (NZ$) Building Value (NZ$) Wall Construction Roof Construction Property ID 1 0.645 2 0.101 141,416 2,826 253,000 B 305,000 B T 3…arrow_forwardfind SFD and BMDarrow_forwardThe data needed to answer this question is given by this link: https://docs.google.com/spreadsheets/d/1vzb03U7Uvzm7X-by3OchQNwYeREzbP6Z-xzZMP2tzNw/edit?usp=sharing if it is easier to make a copy of the data because it is on view only then feel free to do so.arrow_forward
- The data needed to answer this question is given in the following link (file is on view only so if you would like to make a copy to make it easier for yourself feel free to do so) https://docs.google.com/spreadsheets/d/1aV5rsxdNjHnkeTkm5VqHzBXZgW-Ptbs3vqwk0SYiQPo/edit?usp=sharingarrow_forwardA k 000 6 ft A kips Bl D ft C C kips 10 ft 12 ft E B k/ft D E ft tarrow_forwardH.W: show that the equations 1. (x+y)dy+(x-y)dx = 0 2. x²dy+(y²-xy)dx = 0 are homogeneous and solve:arrow_forward
- H.W: Solve the differential equation y' - (1+x)(1 + y²) = 0arrow_forwardThe benchmark is 00.00. The backsights are 6.00, 9.32 and 13.75 and 14.00 The foresights are 6.00, 9.00 and 3.22. What is the height of the instrument? H.I. - 100.00 - 124.85 - 43.07- 24.85arrow_forwardThe benchmark is 100.00. The backsights are 4.00, 6.32 and 12.75. The foresights are 6.00, 9.00 and 3.22. What is the elevation of the point? - 95.14 - 123.08 - 104.85 - 81.78arrow_forward
 Traffic and Highway EngineeringCivil EngineeringISBN:9781305156241Author:Garber, Nicholas J.Publisher:Cengage Learning