
Concept explainers
Effectof cycle length when saturation flow rates at
Answer to Problem 17P
Explanation of Solution
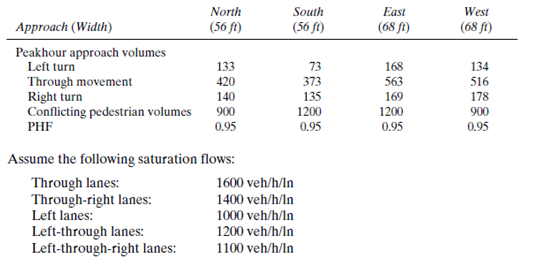
Given information:
Repeat
Shows a detailed layout of the phasing system and the intersection geometry used.
Calculation:
Equivalent hourly flow for north approach at left turn is given by,
Equivalent hourly flow
Peak hour volume
Peak hour factor
Substitute the values in equation
Calculate for other approaches like left turn, right turn and through movement in
| Approach | North | South | East | East |
| Left turn | ||||
| Through movement | ||||
| Right turn |
Calculate the critical volume for other approaches like left turn, right turn and through movement in
Left to north approach is left turn is
Through movement is
| Approach | North | South | East | East |
| Left turn | ||||
| Through movement |
For the saturation flow rates at
Similarly calculate the saturation flow rates for other approaches in
| Approach | saturation flow rates,
|
| Through lanes | |
| Through right lanes | |
| Left lanes | |
| Left through lanes | |
| Left through right lanes |
Maximum value of the ratios of approach flow using formula,
Maximum value of ratios of approach flow to saturation flow to all lanes
Flow on lane groups
Saturation flow on lane group
Substitute the values in equation
Calculate for other
| Approach | Phase | Phase | Phase | Phase |
Sum of critical ratio is given by,
Total lost time is given by,
Total lost time
Number of phases
Lost time for phase
Total all red time
Substitute the values in equation
Cycle length is given by,
Total effective green time is given by,
Allocated green time for phase
Allocated green time for other phases is given in the table
| Phase | Allocated green time in sec |
Minimum green time for phase
Crosswalk length
Average speed of pedestrians
Number of pedestrians crossing during an interval
Substitute the values in equation
Minimum Green time for other phases is given Table
| Phase | Minimum green time in sec |
From the Table
Sum of green and yellow time is given by,
Total cycle length is given by,
Conclusion:
Therefore by increasingsaturation flow rates at
Want to see more full solutions like this?
Chapter 8 Solutions
Traffic And Highway Engineering


- Text Book Problem 7.82 (page 261) Consider the total head-loss in the system forthis flow is 18.56 ft (head-losses in first and second pipe are 13.83 ft and 4.73 ftrespectively). Please show numerical values for EGL/HGL at the beginning/end/intermediatechange point. (Point distribution: elevation determination 5 points, EGL, HGL lines 4points).(I think we are just using the values provided for head losses to solve this problem)arrow_forwardCalculate the BMs (bending moments) at all the joints of the beam shown in Fig.1 using the moment distribution method, and draw the Shear force diagram and Bending moment diagram for the beam shown. The beam is subjected to an UDL of w=65m. L=4.5m L1= 1.8m. Assume the support at C is pinned, and A and B are roller supports. E = 200GPa, I = 250x106 mm4.arrow_forwardCalculate the BMs (bending moments) at all the joints of the beam shown in Fig.1 using the Slope deflection method. The beam is subjected to an UDL of w=65m. L=4.5m L1= 1.8m. Assume the support at C is pinned, and A and B are roller supports. E = 200GPa, I = 250x106 mm4.arrow_forward
- Thank you for your help if you would also provide the equations used .arrow_forwardThe sectors are divided as follows:top right = 1, top left = 2, middle = 3, bottom = 4.(a) Determine the distance yˉ to the centroid of the beam’s cross-sectional area.Solve the next questions by building a table. (Table format Answers) (b) Determine the second moment of area (moment of inertia) about the x′ axis. (c) Determine the second moment of area (moment of inertia) about the y-axis.arrow_forwardinstructions: make sure to follow the instructions and provide complete and detailed solution create/draw a beam with uniformly distributed load and concentrated load after, find the shear and moment equation and ensure to draw it's shear and moment diagram once done, write it's conclusion or observation 4:57 PMarrow_forward
- Solve for forces on pin C and Darrow_forwardBorrow pit soil is being used to fill an 900,00 yd3 of depression. The properties of borrowpit and in-place fill soils obtained from laboratory test results are as follows:• Borrow pit soil: bulk density 105 pcf, moisture content = 8%, and specific gravity = 2.65• In-place fill soil: dry unit weight =120 pcf, and moisture content = 16%(a) How many yd3 of borrow soil is required?(b) What water mass is needed to achieve 16% moisture in the fill soil?(c) What is the in-place density after a long rain?arrow_forwardsolve for dt/dx=f(t,x)=x+t^2arrow_forward
- Calculate the BMs (bending moments) at all the joints of the beam shown in Fig.1 using the slope deflection method, draw the resulting shear force diagran and bending moment diagram. The beam is subjected to an UDL of w=65m. L=4.5m, L1= 1.8m. Assume the support at C is pinned, and A and B are roller supports. E = 200 GPa, I = 250x106 mm4.arrow_forwardProblem 2 (A is fixed and C is a pin) Find the reactions and A and C. 10 k- 6 ft 6 ft B A 2 k/ft 15 ftarrow_forward6. A lake with no outlet is fed by a river with a constant flow of 1200 ft3/s. Water evaporates from the surface at a constant rate of 13 ft3/s per square mile of surface area. The surface area varies with the depth h (in feet) as A (square miles) = 4.5 + 5.5h. What is the equilibrium depth of the lake? Below what river discharge (volume flow rate) will the lake dry up?arrow_forward
 Traffic and Highway EngineeringCivil EngineeringISBN:9781305156241Author:Garber, Nicholas J.Publisher:Cengage Learning
 Solid Waste EngineeringCivil EngineeringISBN:9781305635203Author:Worrell, William A.Publisher:Cengage Learning,