
Concept explainers
(a)
Interpretation: The highest-energy species in the reactants and the highest-energy species in the products should be circled and explanation about reason behind no uphill curve even when generation of oxygen with a uni-negative charge occurs in below reaction should be given.
Concept introduction: Energetics of a reaction describes the energy associated with different components during the process of reaction. Energy diagram is a plot of energy along y-axis and reaction coordinate along x axis. Reaction proceeds when the reactant molecules collide and have proper orientation. The pathway from reactant to product involves transition state. A transition state is a hypothetical state that gives clear picture of the orientation of reactant molecules during collision that is a process of the bonds formed and broken during the reaction. Transition state is the highest energy state of a reaction.
The intermediate involved usually have higher potential energy than reactants species as they are formed transiently and fall back to form products that are more stable and hence reduced in potential energy.
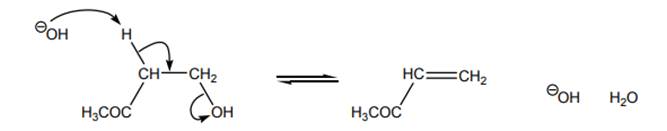
(d)
Interpretation: Energy diagram that best describes the below reaction should be identified.

Concept introduction: Energetics of a reaction describes the energy associated with different components during the process of reaction. Energy diagram is a plot of energy along y-axis and reaction coordinate along x axis. Reaction proceeds when the reactant molecules collide and have proper orientation. The pathway from reactant to product involves transition state. A transition state is a hypothetical state that gives clear picture of the orientation of reactant molecules during collision that is a process of the bonds formed and broken during the reaction. Transition state is the highest energy state of a reaction.
The intermediate involved usually have higher potential energy than reactants species as they are formed transiently and fall back to form products that are more stable and hence reduced in potential energy.
Want to see the full answer?
Check out a sample textbook solution
Chapter 8 Solutions
Custom eBook for Organic Chemistry


- Steps and explanation please. Add how to solve or target similar problems.arrow_forwardWould the following organic synthesis occur in one step? Add any missing products, required catalysts, inorganic reagents, and other important conditions. Please include a detailed explanation and drawings showing how the reaction may occur in one step.arrow_forwardThis organic molecule is dissolved in an acidic aqueous solution: OH OH A short time later sensitive infrared spectroscopy reveals the presence of a new C = O stretch absorption. That is, there must now be a new molecule present with at least one C = O bond. In the drawing area below, show the detailed mechanism that could convert the molecule above into the new molecule. Videos 849 Explanation Check C Click and drag to start dwing a structure. # 3 MAR 23 Add/Remove steparrow_forward||| 7:47 ull 57% ← Problem 19 of 48 Submit Curved arrows are used to illustrate the flow of electrons. Use the reaction conditions provided and follow the curved arrows to draw the product of this carbocation rearrangement. Include all lone pairs and charges as appropriate. H 1,2-alkyl shift +arrow_forwardWould the following organic synthesis occur in one step? Add any missing products, required catalysts, inorganic reagents, and other important conditions. Please include a detailed explanation and drawings showing how the reaction may occur in one step.arrow_forwardBelow is the SN1 reaction of (S)-3-chlorocyclohexene and hydroxide (OH). Draw the missing curved arrows, lone pairs of electrons, and nonzero formal charges. In the third box, draw the two enantiomeric products that will be produced. 5th attempt Please draw all four bonds at chiral centers. Draw the two enantiomeric products that will be produced. Draw in any hydrogen at chiral centers. 1000 4th attempt Feedback Please draw all four bonds at chiral centers. 8. R5 HO: See Periodic Table See Hint H Cl Br Jid See Periodic Table See Hintarrow_forwardShow that a molecule with configuration π4 has a cylindrically symmetric electron distribution. Hint: Let the π orbitals be equal to xf and yf, where f is a function that depends only on the distance from the internuclear axis.arrow_forward(a) Verify that the lattice energies of the alkali metal iodides are inversely proportional to the distances between the ions in MI (M = alkali metal) by plotting the lattice energies given below against the internuclear distances dMI. Is the correlation good? Would a better fit be obtained by plotting the lattice energies as a function of (1 — d*/d)/d, as theoretically suggested, with d* = 34.5 pm? You must use a standard graphing program to plot the graph. It generates an equation for the line and calculates a correlation coefficient. (b) From the graph obtained in (a), estimate the lattice energy of silver iodide. (c) Compare the results of (b) with the experimental value of 886 kJ/mol. If they do not agree, explain the deviation.arrow_forwardCan I please get help with #3 & 4? Thanks you so much!arrow_forwardA solution consisting of 0.200 mol methylbenzene, C,H,CH,, in 500. g of nitrobenzene, CH,NO₂, freezes at 3.2°C. Pure nitrobenzene freezes at 6.0°C. The molal freezing point constant of nitrobenzene is _ °C/m. a) 2.8 b) 3.2 c) 5.6 d) 7.0 e) 14.0arrow_forwardBelow is the SN1 reaction of (S)-3-chlorocyclohexene and hydroxide ("OH). Draw the missing curved arrows, lone pairs of electrons, and nonzero formal charges. In the third box, draw the two enantiomeric products that will be produced. 2nd attempt Please draw all four bonds at chiral centers. 0 D Draw the missing curved arrow notation. Add lone pairs of electrons and nonzero formal charges. + 노 V 1st attempt Feedback Please draw all four bonds at chiral centers. See Periodic Table See Hint F P 41 H Br See Periodic Table See Hint H Larrow_forwardHow close are the Mulliken and Pauling electronegativity scales? (a) Now that the ionization energies and electron affinities have been defined, calculate the Mulliken and Pauling electronegativities for C, N, O and F. Compare them. (Make the necessary adjustments to the values, such as dividing the ionization energies and electron affinities by 230kj/mol) (b) Plot both sets of electronegativities against atomic number (use the same graph). (c) Which scale depends most consistently on position in the Periodic Table?arrow_forwardarrow_back_iosSEE MORE QUESTIONSarrow_forward_ios
 Organic Chemistry: A Guided InquiryChemistryISBN:9780618974122Author:Andrei StraumanisPublisher:Cengage Learning