
Concept explainers
Videos
a.
To identify: The formula that can be used to find the nth term of a geometric sequence to represent the attendance over time.
a.
Answer to Problem 48PFA
D
Explanation of Solution
Given: MULTI-STEP In 2015 , the average attendance for a college’s basketball games was 6500. Since then , the attendance has dropped by an average of 7% each year.
Calculation:
The average attendance is initially 6500 so
Substitute
So, D
b.
To find: The sixth term in the sequence.
b.
Answer to Problem 48PFA
The sixth term of the sequence is then 4,522.
Explanation of Solution
Given: MULTI-STEP In 2015 , the average attendance for a college’s basketball games was 6500. Since then , the attendance has dropped by an average of 7% each year.
Calculation:
From part (a), the formula for the sequence is
Sixth term is when n= 6, Substitute n =6 into the formula gives;
The sixth term of the sequence is then 4,522.
c.
To explain: The insights of the eighth term of the sequence.
c.
Answer to Problem 48PFA
The eighth term then represents the average attendance in2022.
Explanation of Solution
Given: MULTI-STEP In 2015 , the average attendance for a college’s basketball games was 6500. Since then, the attendance has dropped by an average of 7% each year.
Calculation:
The nth term represents the average attendance n -1 years after2015.That is n =1 represents the year 2015 . The eighth term then represents the average attendance 8-1=7 years after 2015 which is the year 2022.
So , The eighth term then represents the average attendance in2022.
Conclusion:
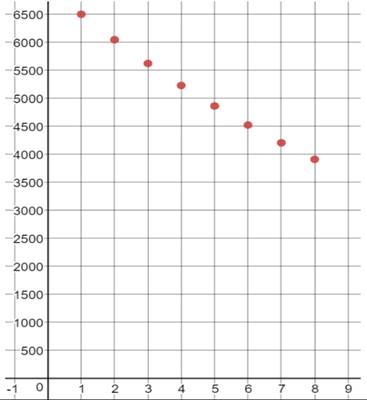
d.
To sketch: The graph of the sequence.
d.
Answer to Problem 48PFA
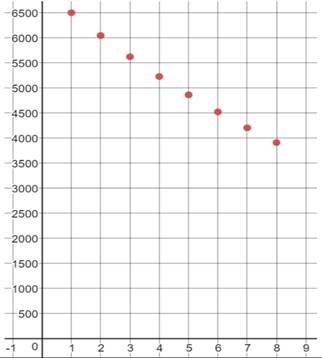
Explanation of Solution
Given: MULTI-STEP In 2015 , the average attendance for a college’s basketball games was 6500. Since then , the attendance has dropped by an average of 7% each year.
Calculation:
Find the first few points on the graph by making a table of values:
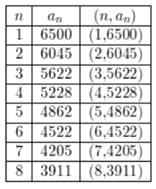
Plot the points we found to sketch the sequence:
Chapter 7 Solutions
Algebra 1, Homework Practice Workbook (MERRILL ALGEBRA 1)
Additional Math Textbook Solutions
Elementary Statistics (13th Edition)
Algebra and Trigonometry (6th Edition)
College Algebra with Modeling & Visualization (5th Edition)
Intro Stats, Books a la Carte Edition (5th Edition)
Introductory Statistics
University Calculus: Early Transcendentals (4th Edition)


- The Course Name Real Analysis please Solve questions by Real Analysisarrow_forwardpart 3 of the question is: A power outage occurs 6 min after the ride started. Passengers must wait for their cage to be manually cranked into the lowest position in order to exit the ride. Sine function model: where h is the height of the last passenger above the ground measured in feet and t is the time of operation of the ride in minutes. What is the height of the last passenger at the moment of the power outage? Verify your answer by evaluating the sine function model. Will the last passenger to board the ride need to wait in order to exit the ride? Explain.arrow_forward2. The duration of the ride is 15 min. (a) How many times does the last passenger who boarded the ride make a complete loop on the Ferris wheel? (b) What is the position of that passenger when the ride ends?arrow_forward
- 3. A scientist recorded the movement of a pendulum for 10 s. The scientist began recording when the pendulum was at its resting position. The pendulum then moved right (positive displacement) and left (negative displacement) several times. The pendulum took 4 s to swing to the right and the left and then return to its resting position. The pendulum's furthest distance to either side was 6 in. Graph the function that represents the pendulum's displacement as a function of time. Answer: f(t) (a) Write an equation to represent the displacement of the pendulum as a function of time. (b) Graph the function. 10 9 8 7 6 5 4 3 2 1 0 t 1 2 3 4 5 6 7 8 9 10 11 12 13 14 15 -1 -5. -6 -7 -8 -9 -10-arrow_forwardA power outage occurs 6 min after the ride started. Passengers must wait for their cage to be manually cranked into the lowest position in order to exit the ride. Sine function model: h = −82.5 cos (3πt) + 97.5 where h is the height of the last passenger above the ground measured in feet and t is the time of operation of the ride in minutes. (a) What is the height of the last passenger at the moment of the power outage? Verify your answer by evaluating the sine function model. (b) Will the last passenger to board the ride need to wait in order to exit the ride? Explain.arrow_forwardThe Colossus Ferris wheel debuted at the 1984 New Orleans World's Fair. The ride is 180 ft tall, and passengers board the ride at an initial height of 15 ft above the ground. The height above ground, h, of a passenger on the ride is a periodic function of time, t. The graph displays the height above ground of the last passenger to board over the course of the 15 min ride. Height of Passenger in Ferris Wheel 180 160 140- €120 Height, h (ft) 100 80 60 40 20 0 ך 1 2 3 4 5 6 7 8 9 10 11 12 13 14 15 Time of operation, t (min) Sine function model: h = −82.5 cos (3πt) + 97.5 where h is the height of the passenger above the ground measured in feet and t is the time of operation of the ride in minutes. What is the period of the sine function model? Interpret the period you found in the context of the operation of the Ferris wheel. Answer:arrow_forward
- 1. Graph the function f(x)=sin(x) −2¸ Answer: y -2π 一元 1 −1 -2 -3 -4+ 元 2πarrow_forward3. Graph the function f(x) = −(x-2)²+4 Answer: f(x) 6 5 4 3 2+ 1 -6-5 -4-3-2-1 × 1 2 3 4 5 6 -1 -2+ ရာ -3+ -4+ -5 -6arrow_forward2. Graph the function f(x) = cos(2x)+1 Answer: -2π 一元 y 3 2- 1 -1 -2+ ရာ -3- Π 2πarrow_forward
- 2. Graph the function f(x) = |x+1+2 Answer: -6-5-4-3-2-1 f(x) 6 5 4 3 2 1 1 2 3 4 5 6 -1 -2 -3 -4 -5 -6arrow_forward1. The table shows values of a function f(x). What is the average rate of change of f(x) over the interval from x = 5 to x = 9? Show your work. X 4 f(x) LO 5 6 7 8 9 10 -2 8 10 11 14 18arrow_forward• Find a real-world situation that can be represented by a sinusoidal function. You may find something online that represents a sinusoidal graph or you can create a sinusoidal graph yourself with a measuring tape and a rope. • Provide a graph complete with labels and units for the x- and y-axes. • Describe the amplitude, period, and vertical shift in terms of the real-world situation.arrow_forward
 Algebra and Trigonometry (6th Edition)AlgebraISBN:9780134463216Author:Robert F. BlitzerPublisher:PEARSON
 Contemporary Abstract AlgebraAlgebraISBN:9781305657960Author:Joseph GallianPublisher:Cengage Learning
 Linear Algebra: A Modern IntroductionAlgebraISBN:9781285463247Author:David PoolePublisher:Cengage Learning
 Algebra And Trigonometry (11th Edition)AlgebraISBN:9780135163078Author:Michael SullivanPublisher:PEARSON
 Introduction to Linear Algebra, Fifth EditionAlgebraISBN:9780980232776Author:Gilbert StrangPublisher:Wellesley-Cambridge Press
 College Algebra (Collegiate Math)AlgebraISBN:9780077836344Author:Julie Miller, Donna GerkenPublisher:McGraw-Hill Education