
Concept explainers
Videos
a.
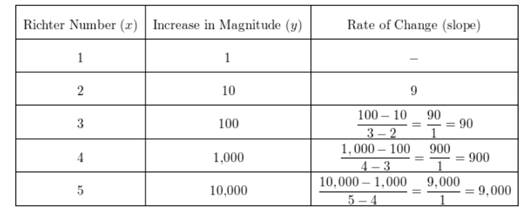
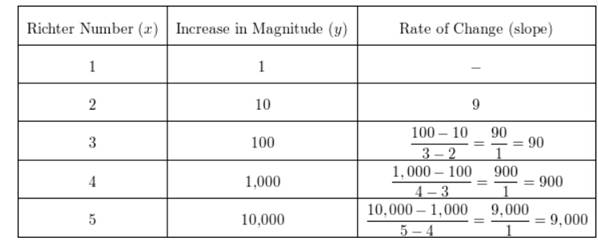
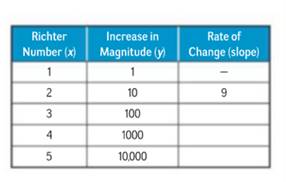
Copy and complete the table. Remember that the rate of change is the change in y divided by the change in x .
a.
Answer to Problem 37PPS
Explanation of Solution
Given: EARTHQUAKES The Richter scale is used to measure the force of an earthquake. The table shows the increase in magnitude for the values on the Richter scale.

Calculation:
Complete table is given below:
b.
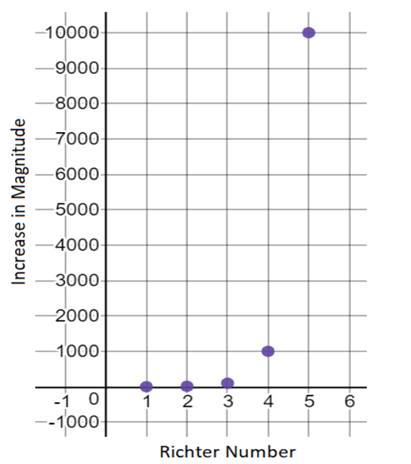
Plot the ordered pairs (Richter number, Increase in magnitude)
b.
Answer to Problem 37PPS
Ordered pairs of the form (Richter number, increase in magnitude) are, (1,1),(2,10),(3,100),(4,1000) and (5,10000).
Explanation of Solution
Given: The Richter scale is used to measure the force of an earthquake. The table shows the increase in magnitude for the values on the Richter scale.

Calculation:
From the table , the ordered pairs of the form (Richter number, increase in magnitude) are, (1,1),(2,10),(3,100),(4,1000) and (5,10000).Plot these points.
c.
Describe the graph that you made of the Richter scale data. Is the rate of change between any two points the same?
c.
Answer to Problem 37PPS
The graph is exponential.
The rate of change between any two points is not the same.
Explanation of Solution
Given: The Richter scale is used to measure the force of an earthquake. The table shows the increase in magnitude for the values on the Richter scale.
Calculation:
The graph appears to be exponential since the y -value appears to be increasing by a constant factor .Since
Conclusion:
The graph is exponential.
The rate of change between any two points is not the same.
d.
Write an exponential equation that represents the Richter scale.
d.
Answer to Problem 37PPS
Explanation of Solution
Given: The Richter scale is used to measure the force of an earthquake. The table shows the increase in magnitude for the values on the Richter scale.

Calculation:
Since the y -values are increasing by a constant factor of 10, the graph can be modeled by a geometric sequence. The exponential function is then of the form
Conclusion:
Chapter 7 Solutions
Glencoe Algebra 1, Student Edition, 9780079039897, 0079039898, 2018
Additional Math Textbook Solutions
Pre-Algebra Student Edition
Elementary Statistics (13th Edition)
Thinking Mathematically (6th Edition)
Calculus: Early Transcendentals (2nd Edition)
Intro Stats, Books a la Carte Edition (5th Edition)


- Use the graph of the polynomial function of degree 5 to identify zeros and multiplicity. Order your zeros from least to greatest. -6 3 6+ 5 4 3 2 1 2 -1 -2 -3 -4 -5 3 4 6 Zero at with multiplicity Zero at with multiplicity Zero at with multiplicityarrow_forwardUse the graph to identify zeros and multiplicity. Order your zeros from least to greatest. 6 5 4 -6-5-4-3-2 3 21 2 1 2 4 5 ૪ 345 Zero at with multiplicity Zero at with multiplicity Zero at with multiplicity Zero at with multiplicity པ་arrow_forwardUse the graph to write the formula for a polynomial function of least degree. -5 + 4 3 ♡ 2 12 1 f(x) -1 -1 f(x) 2 3. + -3 12 -5+ + xarrow_forward
- Use the graph to identify zeros and multiplicity. Order your zeros from least to greatest. 6 -6-5-4-3-2-1 -1 -2 3 -4 4 5 6 a Zero at with multiplicity Zero at with multiplicity Zero at with multiplicity Zero at with multiplicityarrow_forwardUse the graph to write the formula for a polynomial function of least degree. 5 4 3 -5 -x 1 f(x) -5 -4 -1 1 2 3 4 -1 -2 -3 -4 -5 f(x) =arrow_forwardWrite the equation for the graphed function. -8 ง -6-5 + 5 4 3 2 1 -3 -2 -1 -1 -2 4 5 6 6 -8- f(x) 7 8arrow_forward
- Write the equation for the graphed function. 8+ 7 -8 ง A -6-5 + 6 5 4 3 -2 -1 2 1 -1 3 2 3 + -2 -3 -4 -5 16 -7 -8+ f(x) = ST 0 7 8arrow_forwardThe following is the graph of the function f. 48- 44 40 36 32 28 24 20 16 12 8 4 -4 -3 -1 -4 -8 -12 -16 -20 -24 -28 -32 -36 -40 -44 -48+ Estimate the intervals where f is increasing or decreasing. Increasing: Decreasing: Estimate the point at which the graph of ƒ has a local maximum or a local minimum. Local maximum: Local minimum:arrow_forwardFor the following exercise, find the domain and range of the function below using interval notation. 10+ 9 8 7 6 5 4 3 2 1 10 -9 -8 -7 -6 -5 -4 -3 -2 -1 2 34 5 6 7 8 9 10 -1 -2 Domain: Range: -4 -5 -6 -7- 67% 9 -8 -9 -10-arrow_forward
- 1. Given that h(t) = -5t + 3 t². A tangent line H to the function h(t) passes through the point (-7, B). a. Determine the value of ẞ. b. Derive an expression to represent the gradient of the tangent line H that is passing through the point (-7. B). c. Hence, derive the straight-line equation of the tangent line H 2. The function p(q) has factors of (q − 3) (2q + 5) (q) for the interval -3≤ q≤ 4. a. Derive an expression for the function p(q). b. Determine the stationary point(s) of the function p(q) c. Classify the stationary point(s) from part b. above. d. Identify the local maximum of the function p(q). e. Identify the global minimum for the function p(q). 3. Given that m(q) = -3e-24-169 +9 (-39-7)(-In (30-755 a. State all the possible rules that should be used to differentiate the function m(q). Next to the rule that has been stated, write the expression(s) of the function m(q) for which that rule will be applied. b. Determine the derivative of m(q)arrow_forwardSafari File Edit View History Bookmarks Window Help Ο Ω OV O mA 0 mW ర Fri Apr 4 1 222 tv A F9 F10 DII 4 F6 F7 F8 7 29 8 00 W E R T Y U S D பட 9 O G H J K E F11 + 11 F12 O P } [arrow_forwardSo confused. Step by step instructions pleasearrow_forward
 Algebra and Trigonometry (6th Edition)AlgebraISBN:9780134463216Author:Robert F. BlitzerPublisher:PEARSON
 Contemporary Abstract AlgebraAlgebraISBN:9781305657960Author:Joseph GallianPublisher:Cengage Learning
 Linear Algebra: A Modern IntroductionAlgebraISBN:9781285463247Author:David PoolePublisher:Cengage Learning
 Algebra And Trigonometry (11th Edition)AlgebraISBN:9780135163078Author:Michael SullivanPublisher:PEARSON
 Introduction to Linear Algebra, Fifth EditionAlgebraISBN:9780980232776Author:Gilbert StrangPublisher:Wellesley-Cambridge Press
 College Algebra (Collegiate Math)AlgebraISBN:9780077836344Author:Julie Miller, Donna GerkenPublisher:McGraw-Hill Education