
a)
The correctly labeled graph shows a natural
a)
Explanation of Solution
The graph will show the data as follows:
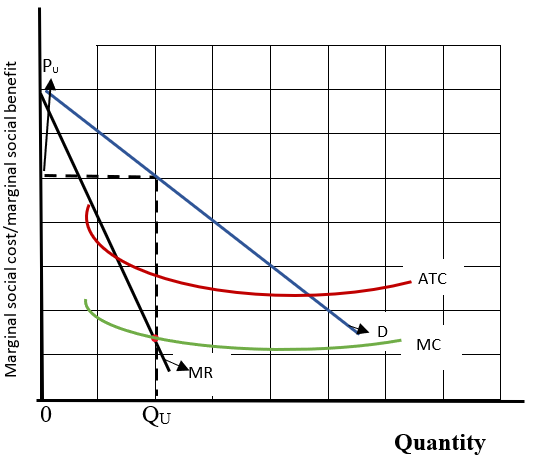
Price is represented in the vertical axis of the graph and quantity is shown on the horizontal axis of the graph. Here, the
The unregulated QU is represented at the point of QU on the horizontal axis where MC and MR are equal and the unregulated PU is found above QU at the vertical axis on a
Introduction: A natural monopoly is a market structure that occurred when the start-up cost is high or there is a high administrative cost and the need for powerful economies of scale to conduct the business.
b)
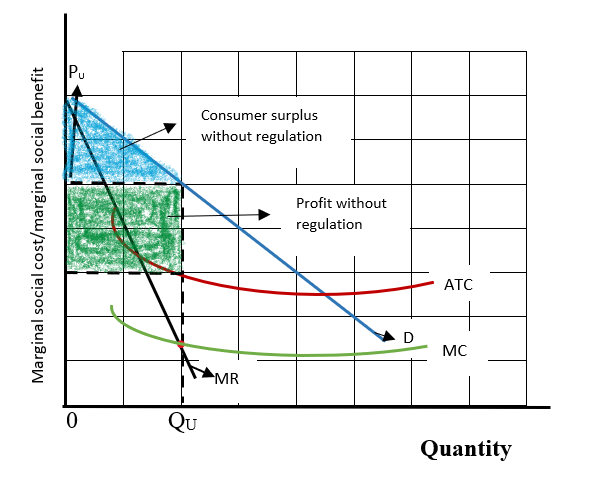
The
b)
Explanation of Solution
The graph will show the data as follows:
0 QU
Price is represented in the vertical axis of the graph and quantity is shown on the horizontal axis of the graph. Here, the average total cost curve is in a downward slope whereas the marginal cost curve is also in a downward slope but it is below the ATC curve.
The unregulated QU is represented at the point of QU on the horizontal axis where MC and MR are equal and the unregulated PU is found above QU at the vertical axis on a demand curve which is in a downward slope.
Consumer surplus without regulation is shown as a triangular shaded area of grey color which is below the demand curve but above the price. The profit of the firm without regulation is found as a correct rectangular shaded area in blue color.
Introduction: A natural monopoly is a market structure that occurred when the start-up cost is high or there is high administrative cost and the need for powerful economies of scale to conduct the business.
c)
The lowest price that regulators could expect the monopoly to maintain in the long run as PR and Quantity as QR
c)
Explanation of Solution
The graph will show the data as follows:
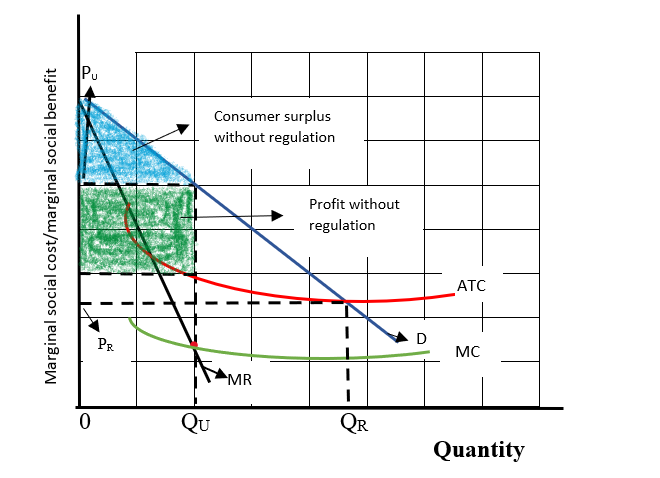
Price is represented in the vertical axis of the graph and quantity is shown on the horizontal axis of the graph. Here, the average total cost curve is in a downward slope whereas the marginal cost curve is also in a downward slope but it is below the ATC curve.
The unregulated QU is represented at the point of QU on the horizontal axis where MC and MR are equal and the unregulated PU is found above QU at the vertical axis on a demand curve which is in a downward slope.
Consumer surplus without regulation is shown as a triangular shaded area of grey color which is below the demand curve but above the price. The profit of the firm without regulation is found as a correct rectangular shaded area in blue color.
The regulated price which can maintain in the long run is shown on the vertical axis by denoting PR and the regulated quantity is shown on the horizontal axis by denoting QR.
Introduction: A natural monopoly is a market structure that occurred when the start-up cost is high or there is a high administrative cost and the need for powerful economies of scale to conduct the business.
d)
The effect on the size of consumer surplus and firm’s profit when the firm charge PR rather than PU
d)
Explanation of Solution
The graph has shown the data as follows:
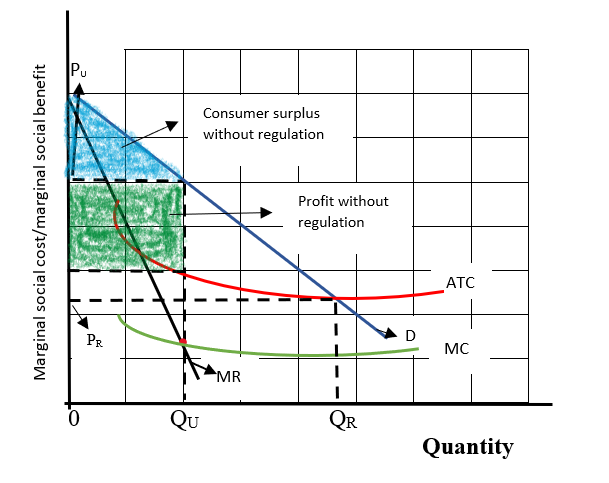
Here, the size of the consumer surplus will increase which will reach the point QR but the profit of the firm will reduce to zero when the PR price is charged by the firm rather than the price of PU where the profit and consumer surplus was high.
Introduction: A natural monopoly is a market structure that occurred when the start-up cost is high or there is a high administrative cost and the need for powerful economies of scale to conduct the business.
Chapter 77 Solutions
Krugman's Economics For The Ap® Course

- Richard has just opened a new restaurant. Not being good at deserts, he has contracted with Carla to provide pies. Carla’s costs are $10 per pie, and she sells the pies to Richard for $25 each. Richard resells them for $50, and he incurs no costs other than the $25 he pays Carla. Assume Carla’s costs go up to $30 per pie. If courts always award expectation damages, which of the following statements is most likely to be true?arrow_forwardDifference-in-Difference In the beginning of 2001, North Dakota legalized fireworks. Suppose you are interested in studying the effect of the legalizing of fireworks on the number of house fires in North Dakota. Unlike North Dakota, South Dakota did not legalize fireworks and continued to ban them. You decide to use a Difference-in-difference (DID) Model. The numbers of house fires in each state at the end of 2000 and 2001 are as follows: Number of house fires in Number of house fires in Year North Dakota 2000 2001 35 50 South Dakota 54 64 a. What is the change in the outcome for the treatment group between 2000 and 2001? Show your working for full credit. (10 points) b. Can we interpret the change in the outcome for the treatment group between 2000 and 2001 as the causal effect of legalizing fireworks on number of house fires? Explain your answer. (10 points)arrow_forwardC. Regression Discontinuity Birth weight is used as a common sign for a newborn's health. In the United States, if a baby has a birthweight below 1500 grams, the newborn is classified as having “very low birth weight". Suppose you want to study the effect of having very low birth weight on the number of hospital visits made before the baby's first birthday. You decide to use Regression Discontinuity to answer this question. The graph below shows the RD model: Number of hospital visits made before baby's first birthday 5 1400 1450 1500 1550 1600 Birthweight (in grams) a. What is the running variable? (5 points) b. What is the cutoff? (5 points) T What is the discontinuity in the graph and how do you interpret it? (10 points)arrow_forward
- C. Regression Discontinuity Birth weight is used as a common sign for a newborn's health. In the United States, if a baby has a birthweight below 1500 grams, the newborn is classified as having “very low birth weight". Suppose you want to study the effect of having very low birth weight on the number of hospital visits made before the baby's first birthday. You decide to use Regression Discontinuity to answer this question. The graph below shows the RD model: Number of hospital visits made before baby's first birthday 5 1400 1450 1500 1550 1600 Birthweight (in grams) a. What is the running variable? (5 points) b. What is the cutoff? (5 points) T What is the discontinuity in the graph and how do you interpret it? (10 points)arrow_forwardExperiments Research suggests that if students use laptops in class, it can have some effect on student achievement. While laptop usage can help students take lecture notes faster, some argue that the laptops may be a source of distraction for the students. Suppose you are interested in looking at the effect of using laptops in class on the students' final exam scores out of 100. You decide to conduct a randomized control trial where you randomly assign some students at UIC to use a laptop in class and other to not use a laptop in class. (Assume that the classes are in person and not online) a. Which people are a part of the treatment group and which people are a part of the control group? (10 points) b. What regression will you run? Define the variables where required. (10 points)arrow_forwardExperiments Research suggests that if students use laptops in class, it can have some effect on student achievement. While laptop usage can help students take lecture notes faster, some argue that the laptops may be a source of distraction for the students. Suppose you are interested in looking at the effect of using laptops in class on the students' final exam scores out of 100. You decide to conduct a randomized control trial where you randomly assign some students at UIC to use a laptop in class and other to not use a laptop in class. (Assume that the classes are in person and not online) a. Which people are a part of the treatment group and which people are a part of the control group? (10 points) b. What regression will you run? Define the variables where required. (10 points)arrow_forward
- Dummy variables News reports claim that in the last year television watching has increased. You believe that rising unemployment during Covid may be one of the causes for this. Suppose you are interested in looking at the effect of being unemployed on the hours spent watching Netflix per day. You collect data on 10,000 people from Chicago who are between the age of 20 and 60. You define the dummy variable Unemployed which takes the value 1 for those who are unemployed and 0 for those who are employed. Equation 1: Hours spent watching Netflix₁ = ßo + B₁Unemployed; + ε¿ Following is the output for equation 1: reg hours spent_watching_netflix unemployed Source SS df MS Number of obs 10,000 F(1, 9998) = 14314.03 Model Residual 3539.70065 2472.39364 9,998 1 3539.70065 .247288822 Prob F R-squared == 0.0000 = 0.5888 Total 6012.09429 9,999 . 601269556 Adj R-squared Root MSE = 0.5887 .49728 hours spen~x Coef. Std. Err. t P>|t| [95% Conf. Interval] unemployed cons 1.189908 .0099456 119.64…arrow_forwardDummy variables News reports claim that in the last year television watching has increased. You believe that rising unemployment during Covid may be one of the causes for this. Suppose you are interested in looking at the effect of being unemployed on the hours spent watching Netflix per day. You collect data on 10,000 people from Chicago who are between the age of 20 and 60. You define the dummy variable Unemployed which takes the value 1 for those who are unemployed and 0 for those who are employed. Equation 1: Hours spent watching Netflix₁ = ßo + B₁Unemployed; + ε¿ Following is the output for equation 1: reg hours spent_watching_netflix unemployed Source SS df MS Number of obs 10,000 F(1, 9998) = 14314.03 Model Residual 3539.70065 2472.39364 9,998 1 3539.70065 .247288822 Prob F R-squared == 0.0000 = 0.5888 Total 6012.09429 9,999 . 601269556 Adj R-squared Root MSE = 0.5887 .49728 hours spen~x Coef. Std. Err. t P>|t| [95% Conf. Interval] unemployed cons 1.189908 .0099456 119.64…arrow_forward17. The South African government's distributive stance is clear given its prioritisation of social spending, which includes grants and subsidised goods. Discuss the advantages and disadvantages of an in-kind subsidy versus a cash grant. Use a graphical illustration to support your arguments. [15] 18. Redistributive expenditure can take the form of direct cash transfers (grants) and/or in-kind subsidies. With references to the graphs below, discuss the merits of these two transfer types in the presence and absence of a positive externality. [14] 19. Expenditure on education and healthcare have, by far, the biggest redistributive effect in South Africa' by one estimate dropping the Gini-coefficient by 10 percentage points. Discuss the South African government's performance in health and education provision by evaluating both the outputs and outcomes in these areas of service delivery. [15] 20. Define the following concepts and provide an example in each case: tax rate structure, general…arrow_forward
- Summarise the case for government intervention in the education marketarrow_forwardShould Maureen question the family about the history of the home? Can Maureen access public records for proof of repairs?arrow_forward3. Distinguish between a direct democracy and a representative democracy. Use appropriate examples to support your answers. [4] 4. Explain the distinction between outputs and outcomes in social service delivery [2] 5. A R1000 tax payable by all adults could be viewed as both a proportional tax and a regressive tax. Do you agree? Explain. [4] 6. Briefly explain the displacement effect in Peacock and Wiseman's model of government expenditure growth and provide a relevant example of it in the South African context. [5] 7. Explain how unbalanced productivity growth may affect government expenditure and briefly comment on its relevance to South Africa. [5] 8. South Africa has recently proposed an increase in its value-added tax rate to 15%, sparking much controversy. Why is it argued that value-added tax is inequitable and what can be done to correct the inequity? [5] 9. Briefly explain the difference between access to education and the quality of education, and why we should care about the…arrow_forward

 Principles of Economics (12th Edition)EconomicsISBN:9780134078779Author:Karl E. Case, Ray C. Fair, Sharon E. OsterPublisher:PEARSON
 Engineering Economy (17th Edition)EconomicsISBN:9780134870069Author:William G. Sullivan, Elin M. Wicks, C. Patrick KoellingPublisher:PEARSON
 Principles of Economics (MindTap Course List)EconomicsISBN:9781305585126Author:N. Gregory MankiwPublisher:Cengage Learning
 Managerial Economics: A Problem Solving ApproachEconomicsISBN:9781337106665Author:Luke M. Froeb, Brian T. McCann, Michael R. Ward, Mike ShorPublisher:Cengage Learning
 Managerial Economics & Business Strategy (Mcgraw-...EconomicsISBN:9781259290619Author:Michael Baye, Jeff PrincePublisher:McGraw-Hill Education