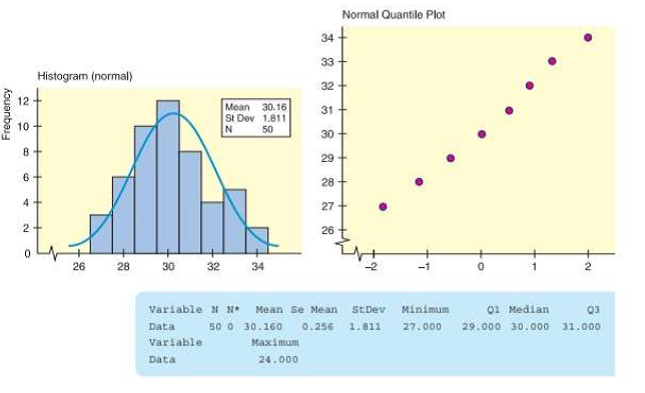
Critical Thinking: Normality Consider the following data. The summary statistics histogram, and normal quantile plot were generated using Minitab.
| 27 | 27 | 27 | 28 | 28 | 28 | 28 | 28 | 28 | 29 | 29 | 29 | 29 | 29 | 29 |
| 29 | 29 | 29 | 29 | 30 | 30 | 30 | 30 | 30 | 30 | 30 | 30 | 30 | 30 | 30 |
| 30 | 31 | 31 | 31 | 31 | 31 | 31 | 31 | 31 | 32 | 32 | 32 | 32 | 33 | 33 |
| 33 | 33 | 33 | 34 | 34 |
(a) Does the histogram indicate normality for the data distribution? Explain
(b) Does the normal quantile plot indicate normality for the data distribution?
Explain.
(c) Compute the
(d) Compute Pearson's index. Does the index value indicate skewness?
(e) Using parts (a) through (dl. would you say the data are from a

Trending nowThis is a popular solution!

Chapter 7 Solutions
Bundle: Understanding Basic Statistics, Loose-leaf Version, 7th + WebAssign Printed Access Card for Brase/Brase's Understanding Basic Statistics, ... for Peck's Statistics: Learning from Data
 Glencoe Algebra 1, Student Edition, 9780079039897...AlgebraISBN:9780079039897Author:CarterPublisher:McGraw Hill
 Big Ideas Math A Bridge To Success Algebra 1: Stu...AlgebraISBN:9781680331141Author:HOUGHTON MIFFLIN HARCOURTPublisher:Houghton Mifflin Harcourt
 Holt Mcdougal Larson Pre-algebra: Student Edition...AlgebraISBN:9780547587776Author:HOLT MCDOUGALPublisher:HOLT MCDOUGAL


