Interpretation:
The integration of
Concept introduction:
Crack growth rate is defined as the rate at which propagation of crack is considered before failure with respect to stress intensity factor
The variation of crack growth rate with stress intensity factor is shown in the graph below:
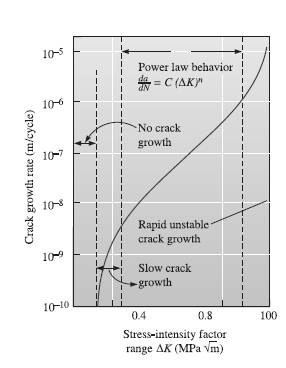
The relationship for power law model is given by,
Where,
C and n are empirical constants depending upon the material.
Explanation of Solution
The given equation for basis is:
The value of stress intensity factor has a dependency on the size of the material.
The value of growth rate increases in unstable manner till fracture occurred,
Defining the relation based on geometrical factor and stress, the value of maximum and minimum stress intensity factor is,
Putting the values in the formula of stress intensity factor,
The difference between the maximum and minimum stress,
Replacing minimum and maximum stress with
Considering the value of stress intensity factor in terms of constant variable n,
On rearranging equation (1),
Putting the value of
Integrating the above equation with respect to initial and final flaw size. By Applying limits,
Thus, the required value of equation is
Want to see more full solutions like this?
Chapter 7 Solutions
Essentials Of Materials Science And Engineering, Si Edition

- 6. A lake with no outlet is fed by a river with a constant flow of 1200 ft3/s. Water evaporates from the surface at a constant rate of 13 ft3/s per square mile of surface area. The surface area varies with the depth h (in feet) as A (square miles) = 4.5 + 5.5h. What is the equilibrium depth of the lake? Below what river discharge (volume flow rate) will the lake dry up?arrow_forwardProblem 5 (A, B, C and D are fixed). Find the reactions at A and D 8 k B 15 ft A -20 ft C 10 ft Darrow_forwardProblem 4 (A, B, E, D and F are all pin connected and C is fixed) Find the reactions at A, D and F 8 m B 6m E 12 kN D F 4 marrow_forward
- ##2# Superheated steam powers a steam turbine for the production of electrical energy. The steam expands in the turbine and at an intermediate expansion pressure (0.1 Mpa) a fraction is extracted for a regeneration process in a surface regenerator. The turbine has an isentropic efficiency of 90% Design the simplified power plant schematic Analyze it on the basis of the attached figure Determine the power generated and the thermal efficiency of the plant ### Dados in the attached imagesarrow_forwardProblem 1 (A, C and D are pins) Find the reactions and A, C and D. D 6 m B 12 kN/m 8 m A C 6 marrow_forwardUniform Grade of Pipe Station of Point A is 9+50.00. Elevation Point A = 250.75.Station of Point B is 13+75.00. Elevation Point B = 244.10 1) Calculate flowline of pipe elevations at every 50 ft. interval (Half Station). 2) Tabulate station and elevation for each station like shown on example 3) Draw Sketcharrow_forward
- ### To make a conclusion for a report of an experiment on rockets, in which the openrocket software was used for the construction and modeling of two rockets: one one-stage and one two-stage. First rocket (single-stage) reached a maximum vertical speed of 100 m/s and a maximum height of 500 m The second rocket (two-stage) reached a maximum vertical speed of 50 m/s and a maximum height of 250 m To make a simplified conclusion, taking into account the efficiency of the software in the study of rocketsarrow_forwardThe images I have uploaded are the part 1 to 4 and questions below are continue on the questions uploaded 5. C++ Class Template with Method Stubs #pragma once #include <iostream> #include <string> #include <stdexcept> #include <vector> template <typename T> class HashTable { private: struct Entry { std::string key; T value; bool isOccupied; bool isDeleted; Entry() : key(""), value(), isOccupied(false), isDeleted(false) {} }; Entry* table; size_t capacity; size_t size; double loadFactorThreshold; size_t customHash(const std::string& key) const { size_t hash = 5381; for (char c : key) { hash = ((hash << 5) + hash) + c; } return hash; } size_t probe(const std::string& key, bool forInsert = false) const; void resize(); public: // Constructor HashTable(size_t initialCapacity = 101); // Big…arrow_forwardDetermine the coefficients of polynomial for the polynomial function of Cam profile based on the boundary conditions shown in the figure. S a 3 4 5 C₁ (+) Ꮎ В s = q + q { + c f * + q € * + q ( +c+c+c 6 Ꮎ +C5 +C β В В 0 cam angle 0 B 7 (arrow_forward
- ### Superheated steam powers a steam turbine for the production of electrical energy. The steam expands in the turbine and at an intermediate expansion pressure (0.1 Mpa) a fraction is extracted for a regeneration process in a surface regenerator. The turbine has an isentropic efficiency of 90% Design the simplified power plant schematic Analyze it on the basis of the attached figure Determine the power generated and the thermal efficiency of the plant ### Dados in the attached imagesarrow_forwardThe machine below forms metal plates through the application of force. Two toggles (ABC and DEF) transfer forces from the central hydraulic cylinder (H) to the plates that will be formed. The toggles then push bar G to the right, which then presses a plate (p) into the cavity, thus shaping it. In this case, the plate becomes a section of a sphere. If the hydraulic cylinder can produce a maximum force of F = 10 kN, then what is the maximum P value (i.e. Pmax) that can be applied to the plate when θ = 35°? Also, what are the compressive forces in the toggle rods in that situation? Finally, what happens to Pmax and the forces in the rods as θ decreases in magnitude?arrow_forwardAnswer all the questions What is the minimum value of capacitor C1 required such that Vfiltered does not drop below 8 V? Use the design equation(but make sure you use the right “frequency” and the correct ripple voltage). Show your calculations. Display your circuit in circuit js. Display Vsecondary (can use the voltage across the added 100 kΩ resistor) and Vfiltered in a “Combined Scope”. Display VDC in a separate scope: a) Turn on “Max Scale”, “Show Peak Value” and “Show Negative Peak Value”: b) Run the simulator and adjust the window and simulation speed and time step to be able to see a couple of cycles. Include a screen capture Document the minimum and maximum values for Vfiltered in your lab report. Is Vfiltered maintained to be above 8 V? By how much? Why? Explain the waveform shape captured Vfiltered. It may help your understanding to rerun the simulation with C1 removed and compare that waveform for Vfiltered to that capturedarrow_forward
 MATLAB: An Introduction with ApplicationsEngineeringISBN:9781119256830Author:Amos GilatPublisher:John Wiley & Sons Inc
 Essentials Of Materials Science And EngineeringEngineeringISBN:9781337385497Author:WRIGHT, Wendelin J.Publisher:Cengage,
 Industrial Motor ControlEngineeringISBN:9781133691808Author:Stephen HermanPublisher:Cengage Learning
 Basics Of Engineering EconomyEngineeringISBN:9780073376356Author:Leland Blank, Anthony TarquinPublisher:MCGRAW-HILL HIGHER EDUCATION
 Structural Steel Design (6th Edition)EngineeringISBN:9780134589657Author:Jack C. McCormac, Stephen F. CsernakPublisher:PEARSON
 Fundamentals of Materials Science and Engineering...EngineeringISBN:9781119175483Author:William D. Callister Jr., David G. RethwischPublisher:WILEY