Transfusions for Bleeding in the Stomach Should patients who are bleeding from the stomach get transfusions when their hemoglobin level falls below 7 grams per deciliter (restrictive strategy) or when it falls to 9 grams per deciliter (liberal strategy)? A study used random assignment with 461 patients assigned to the restrictive strategy and 460 to the liberal strategy (Villanueva et al. 2013). The table shows survival after six weeks in each group. a. Calculate the percentage alive in each of the treatment groups, and write a sentence comparing the percentages in the context of this study. Call the restrictive group 1 and the liberal group 2, and find the difference, p 1 − p 2 . b. Find a 95 % confidence interval for the difference in proportions alive in the two groups, and explain whether the interval captures 0 and what that means. Use the same difference as in part a. Assume that the conditions are met, although we have random assignment and not a random sample. c. For the 95 % confidence interval from part b, explain what the signs of the boundary values mean and whether we can conclude that one treatment causes the better result. d. If you had a relative with bleeding and his hemoglobin level dropped to 8.5 grams per deciliter, would you argue for a transfusion or wait until it dropped further?
Transfusions for Bleeding in the Stomach Should patients who are bleeding from the stomach get transfusions when their hemoglobin level falls below 7 grams per deciliter (restrictive strategy) or when it falls to 9 grams per deciliter (liberal strategy)? A study used random assignment with 461 patients assigned to the restrictive strategy and 460 to the liberal strategy (Villanueva et al. 2013). The table shows survival after six weeks in each group. a. Calculate the percentage alive in each of the treatment groups, and write a sentence comparing the percentages in the context of this study. Call the restrictive group 1 and the liberal group 2, and find the difference, p 1 − p 2 . b. Find a 95 % confidence interval for the difference in proportions alive in the two groups, and explain whether the interval captures 0 and what that means. Use the same difference as in part a. Assume that the conditions are met, although we have random assignment and not a random sample. c. For the 95 % confidence interval from part b, explain what the signs of the boundary values mean and whether we can conclude that one treatment causes the better result. d. If you had a relative with bleeding and his hemoglobin level dropped to 8.5 grams per deciliter, would you argue for a transfusion or wait until it dropped further?
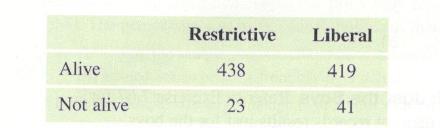
Solution Summary: The author calculates the percentage of patients alive in each of the treatment groups. The percentage is more in restrictive group than in liberal group.
Transfusions for Bleeding in the Stomach Should patients who are bleeding from the stomach get transfusions when their hemoglobin level falls below 7 grams per deciliter (restrictive strategy) or when it falls to 9 grams per deciliter (liberal strategy)? A study used random assignment with 461 patients assigned to the restrictive strategy and 460 to the liberal strategy (Villanueva et al. 2013). The table shows survival after six weeks in each group.
a. Calculate the percentage alive in each of the treatment groups, and write a sentence comparing the percentages in the context of this study. Call the restrictive group 1 and the liberal group 2, and find the difference,
p
1
−
p
2
.
b. Find a
95
%
confidence interval for the difference in proportions alive in the two groups, and explain whether the interval captures 0 and what that means. Use the same difference as in part a. Assume that the conditions are met, although we have random assignment and not a random sample.
c. For the
95
%
confidence interval from part b, explain what the signs of the boundary values mean and whether we can conclude that one treatment causes the better result.
d. If you had a relative with bleeding and his hemoglobin level dropped to 8.5 grams per deciliter, would you argue for a transfusion or wait until it dropped further?
Please solving problem2
Problem1
We consider a two-period binomial model with the following properties: each period lastsone (1) year and the current stock price is S0 = 4. On each period, the stock price doubleswhen it moves up and is reduced by half when it moves down. The annual interest rateon the money market is 25%. (This model is the same as in Prob. 1 of HW#2).We consider four options on this market: A European call option with maturity T = 2 years and strike price K = 5; A European put option with maturity T = 2 years and strike price K = 5; An American call option with maturity T = 2 years and strike price K = 5; An American put option with maturity T = 2 years and strike price K = 5.(a) Find the price at time 0 of both European options.(b) Find the price at time 0 of both American options. Compare your results with (a)and comment.(c) For each of the American options, describe the optimal exercising strategy.
Problem 1.We consider a two-period binomial model with the following properties: each period lastsone (1) year and the current stock price is S0 = 4. On each period, the stock price doubleswhen it moves up and is reduced by half when it moves down. The annual interest rateon the money market is 25%.
We consider four options on this market: A European call option with maturity T = 2 years and strike price K = 5; A European put option with maturity T = 2 years and strike price K = 5; An American call option with maturity T = 2 years and strike price K = 5; An American put option with maturity T = 2 years and strike price K = 5.(a) Find the price at time 0 of both European options.(b) Find the price at time 0 of both American options. Compare your results with (a)and comment.(c) For each of the American options, describe the optimal exercising strategy.(d) We assume that you sell the American put to a market participant A for the pricefound in (b). Explain how you act on the market…
What is the standard scores associated to the left of z is 0.1446
Calculus for Business, Economics, Life Sciences, and Social Sciences (14th Edition)
Knowledge Booster
Learn more about
Need a deep-dive on the concept behind this application? Look no further. Learn more about this topic, statistics and related others by exploring similar questions and additional content below.
Introduction to experimental design and analysis of variance (ANOVA); Author: Dr. Bharatendra Rai;https://www.youtube.com/watch?v=vSFo1MwLoxU;License: Standard YouTube License, CC-BY


 Glencoe Algebra 1, Student Edition, 9780079039897...AlgebraISBN:9780079039897Author:CarterPublisher:McGraw Hill
 Big Ideas Math A Bridge To Success Algebra 1: Stu...AlgebraISBN:9781680331141Author:HOUGHTON MIFFLIN HARCOURTPublisher:Houghton Mifflin Harcourt
 Holt Mcdougal Larson Pre-algebra: Student Edition...AlgebraISBN:9780547587776Author:HOLT MCDOUGALPublisher:HOLT MCDOUGAL