
Intro Stats, Books a la Carte Edition (5th Edition)
5th Edition
ISBN: 9780134210285
Author: Richard D. De Veaux, Paul Velleman, David E. Bock
Publisher: PEARSON
expand_more
expand_more
format_list_bulleted
Concept explainers
Videos
Textbook Question
Chapter 7, Problem 66E
Cost of living 2016 Numbeo.com lists the cost of living (COL) for 576 cities around the world. It reports the typical cost of a number of staples. Here are a
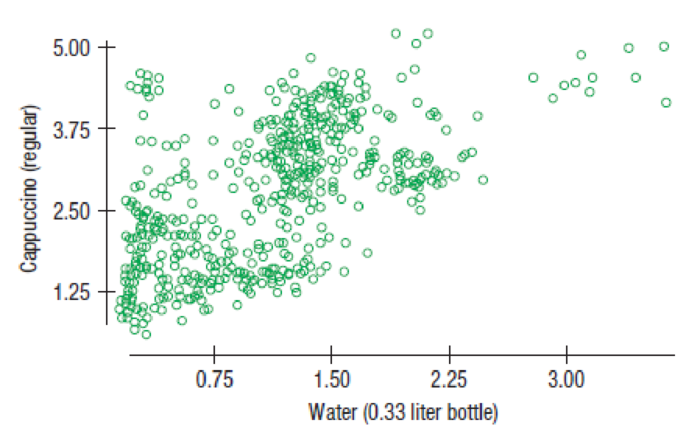
- a) Using this information, describe the association between the costs of a cappuccino and a third of a liter of water.
- b) The
correlation is 0.597. Find and interpret the value of R2. - c) The regression equation predicting the cost of a cappuccino from the cost of a liter of water is
 In Christchurch, New Zealand, a third of a liter of water costs $2, and a cappuccino is $3.37. Calculate and interpret the residual for Christchurch.
Expert Solution & Answer
Want to see the full answer?
Check out a sample textbook solution
Students have asked these similar questions
1 - Multiple Regression Equations and Predictions with XLMiner Analysis ToolPak (Structured)
Video
The owner of Showtime Movie Theaters, Inc., would like to predict weekly gross revenue as a function of advertising expenditures. Historical data for a
sample of eight weeks are entered into the Microsoft Excel Online file below. Use the XLMiner Analysis ToolPak to perform your regression analysis in the
designated areas of the spreadsheet.
Due to a recent change by Microsoft you will need to open the XLMiner Analysis ToolPak add-in manually from the home ribbon. Screenshot of ToolPak
X
Open spreadsheet
a. Develop an estimated regression equation with the amount of television advertising as the independent variable (to 2 decimals).
JAN
27
Revenue =
× TVAdv
+
b. Develop an estimated regression equation with both television advertising and newspaper advertising as the independent variables (to 2 decimals).
Revenue =
+
TVAdy +
NewsAdv
c. Is the estimated regression equation coefficient for…
Question 2: When John started his first job, his first end-of-year salary was $82,500. In the following years, he received salary raises as shown in the following table.
Fill the Table: Fill the following table showing his end-of-year salary for each year. I have already provided the end-of-year salaries for the first three years. Calculate the end-of-year salaries for the remaining years using Excel. (If you Excel answer for the top 3 cells is not the same as the one in the following table, your formula / approach is incorrect) (2 points)
Geometric Mean of Salary Raises: Calculate the geometric mean of the salary raises using the percentage figures provided in the second column named “% Raise”. (The geometric mean for this calculation should be nearly identical to the arithmetic mean. If your answer deviates significantly from the mean, it's likely incorrect. 2 points)
Hint for the first part of question 2: To assist you with filling out the table in the first part of the question,…
Consider a sample with data values of 27, 25, 20, 15, 30, 34, 28, and 25. Compute the range, interquartile range, variance, and standard deviation (to a maximum of 2 decimals, if decimals are necessary).
Range
Interquartile range
Variance
Standard deviation
Chapter 7 Solutions
Intro Stats, Books a la Carte Edition (5th Edition)
Ch. 7.4 - A scatterplot of house Price (in dollars) vs....Ch. 7.4 - A scatterplot of house Price (in dollars) vs....Ch. 7.4 - A scatterplot of house Price (in dollars) vs....Ch. 7.4 - A scatterplot of house Price (in dollars) vs....Ch. 7.4 - A scatterplot of house Price (in dollars) vs....Ch. 7.4 - Prob. 6JCCh. 7.6 - Back to our regression of house Price () on house...Ch. 7.6 - Back to our regression of house Price () on house...Ch. 7.6 - Back to our regression of house Price () on house...Ch. 7 - True or false If false, explain briefly. a) We...
Ch. 7 - True or false II If false, explain briefly. a)...Ch. 7 - Prob. 3ECh. 7 - Prob. 4ECh. 7 - Bookstore sales revisited Recall the data we saw...Ch. 7 - Prob. 6ECh. 7 - Prob. 7ECh. 7 - Prob. 8ECh. 7 - Bookstore sales once more Here are the residuals...Ch. 7 - Prob. 10ECh. 7 - Prob. 11ECh. 7 - Prob. 12ECh. 7 - Prob. 13ECh. 7 - Prob. 14ECh. 7 - Prob. 15ECh. 7 - Prob. 16ECh. 7 - More cereal Exercise 15 describes a regression...Ch. 7 - Prob. 18ECh. 7 - Another bowl In Exercise 15, the regression model...Ch. 7 - More engine size In Exercise 16, the regression...Ch. 7 - Cereal again The correlation between a cereals...Ch. 7 - Prob. 22ECh. 7 - Prob. 23ECh. 7 - Prob. 24ECh. 7 - Prob. 25ECh. 7 - Prob. 26ECh. 7 - Prob. 27ECh. 7 - Residuals Tell what each of the residual plots...Ch. 7 - Real estate A random sample of records of home...Ch. 7 - Prob. 30ECh. 7 - Prob. 31ECh. 7 - Prob. 32ECh. 7 - Real estate again The regression of Price on Size...Ch. 7 - Prob. 34ECh. 7 - Prob. 35ECh. 7 - More misinterpretations A Sociology student...Ch. 7 - Real estate redux The regression of Price on Size...Ch. 7 - Prob. 38ECh. 7 - Prob. 39ECh. 7 - Prob. 40ECh. 7 - Prob. 41ECh. 7 - Last ride Consider the roller coasters (with the...Ch. 7 - Prob. 43ECh. 7 - Prob. 44ECh. 7 - Prob. 45ECh. 7 - Prob. 46ECh. 7 - Prob. 47ECh. 7 - Prob. 48ECh. 7 - Prob. 49ECh. 7 - Interest rates and mortgages 2015 again In Chapter...Ch. 7 - Online clothes An online clothing retailer keeps...Ch. 7 - Online clothes II For the online clothing retailer...Ch. 7 - Prob. 53ECh. 7 - Success in college Colleges use SAT scores in the...Ch. 7 - SAT, take 2 Suppose we wanted to use SAT math...Ch. 7 - Prob. 56ECh. 7 - Prob. 57ECh. 7 - Wildfires 2015sizes We saw in Exercise 57 that the...Ch. 7 - Used cars 2014 Carmax.com lists numerous Toyota...Ch. 7 - Drug abuse revisited Chapter 6, Exercise 42...Ch. 7 - Prob. 61ECh. 7 - Prob. 62ECh. 7 - Prob. 63ECh. 7 - Chicken Chicken sandwiches are often advertised as...Ch. 7 - Prob. 65ECh. 7 - Cost of living 2016 Numbeo.com lists the cost of...Ch. 7 - Prob. 67ECh. 7 - Prob. 68ECh. 7 - Prob. 69ECh. 7 - Climate change 2016, revisited In Exercise 69, we...Ch. 7 - Prob. 71ECh. 7 - Prob. 72ECh. 7 - Prob. 73ECh. 7 - Heptathlon revisited again We saw the data for the...Ch. 7 - Hard water In an investigation of environmental...Ch. 7 - Gators Wildlife researchers monitor many wildlife...Ch. 7 - Prob. 77ECh. 7 - Least squares Consider the four points (200,1950),...
Knowledge Booster


Learn more about
Need a deep-dive on the concept behind this application? Look no further. Learn more about this topic, statistics and related others by exploring similar questions and additional content below.Similar questions
- Perform a Step by step following tests in Microsoft Excel. Each of the following is 0.5 points, with a total of 6 points. Provide your answers in the following table. Median Standard Deviation Minimum Maximum Range 1st Quartile 2nd Quartile 3rd Quartile Skewness; provide a one sentence explanation of what does the skewness value indicates Kurtosis; provide a one sentence explanation of what does the kurtosis value indicates Make a labelled histogram; no point awarded if it is not labelled Make a labelled boxplot; no point awarded if it is not labelled Data 27 30 22 25 24 22 20 28 20 26 21 23 24 20 28 30 20 28 29 30 21 26 29 25 26 25 20 30 26 28 25 21 22 27 27 24 26 22 29 28 30 22 22 22 30 21 21 30 26 20arrow_forwardObtain the linear equation for trend for time series with St² = 140, Ey = 16.91 and Σty= 62.02, m n = 7arrow_forwardA quality characteristic of a product is normally distributed with mean μ and standard deviation σ = 1. Speci- fications on the characteristic are 6≤x≤8. A unit that falls within specifications on this quality characteristic results in a profit of Co. However, if x 8, the profit is -C2. Find the value ofμ that maximizes the expected profit.arrow_forward
- A) The output voltage of a power supply is normally distributed with mean 5 V and standard deviation 0.02 V. If the lower and upper specifications for voltage are 4.95 V and 5.05 V, respectively, what is the probability that a power supply selected at random conform to the specifications on voltage? B) Continuation of A. Reconsider the power supply manufacturing process in A. Suppose We wanted to improve the process. Can shifting the mean reduce the number of nonconforming units produced? How much would the process variability need to be reduced in order to have all but one out of 1000 units conform to the specifications?arrow_forwardder to complete the Case X T Civil Service Numerical Test Sec X T Casework Skills Practice Test Maseline Vaseline x + euauthoring.panpowered.com/DeliveryWeb/Civil Service Main/84589a48-6934-4b6e-a6e1-a5d75f559df9?transferToken-News NGSSON The table below shows the best price available for various items from 4 uniform suppliers. The prices do not include VAT (charged at 20%). Item Waterproof boots A1-Uniforms (£)Best Trade (£)Clothing Tech (£)Dress Right (£) 59.99 39.99 59.99 49.99 Trousers 9.89 9.98 9.99 11.99 Shirts 14.99 15.99 16.99 12.99 Hi-Vis vest 4.49 4.50 4.00 4.00 20.00 25.00 19.50 19.99 Hard hats A company needs to buy a set of 12 uniforms which includes 1 of each item. If the special offers are included which supplier is cheapest? OOO A1-Uniforms Best Trade Clothing Tech Q Search + ** 109 8 CO* F10 Home F11 F12 6arrow_forwardto complete the Case × T Civil Service Numerical Test Sec x T Casework Skills Practice Test + Vaseline euauthoring.panpowered.com/DeliveryWeb/Civil Service Main/84589a48-b934-4b6e-a6e1-a5d75f559df9?transferToken=MxNewOS NGFSPSZSMOMzuz The table below shows the best price available for various items from 4 uniform suppliers. The prices do not include VAT (charged at 20%). Item A1-Uniforms (£)Best Trade (£)Clothing Tech (£)Dress Right (£) Waterproof boots 59.99 39.99 59.99 49.99 Trousers 9.89 9.98 9.99 11.99 Shirts 14.99 15.99 16.99 12.99 Hi-Vis vest 4.49 4.50 4.00 4.00 20.00 25.00 19.50 19.99 Hard hats A company needs to buy a set of 12 uniforms which includes 1 of each item. If the special offers are included, which supplier is cheapest? O O O O A1-Uniforms Best Trade Clothing Tech Dress Right Q Search ENG L UK +0 F6 四吧 6 78 ㄓ F10 9% * CO 1 F12 34 Oarrow_forward
- Critics review films out of 5 based on three attributes: the story, the special effects and the acting. The ratings of four critics for a film are collected in the table below.CriticSpecialStory rating Effects rating Acting rating Critic 14.44.34.5Critic 24.14.23.9Critic 33.943.4Critic 44.24.14.2Critic 1 also gave the film a rating for the Director's ability. If the average of Critic 1's ratings was 4.3 what rating did they give to the Director's ability?3.94.04.14.24.3arrow_forwardTwo measurements are made of some quantity. For the first measurement, the average is 74.4528, the RMS error is 6.7441, and the uncertainty of the mean is 0.9264. For the second one, the average is 76.8415, the standard deviation is 8.3348, and the uncertainty of the mean is 1.1448. The expected value is exactly 75. 13. Express the first measurement in public notation. 14. Is there a significant difference between the two measurements? 1 15. How does the first measurement compare with the expected value? 16. How does the second measurement compare with the expected value?arrow_forwardA hat contains slips of paper numbered 1 through 6. You draw two slips of paper at random from the hat,without replacing the first slip into the hat.(a) (5 points) Write out the sample space S for this experiment.(b) (5 points) Express the event E : {the sum of the numbers on the slips of paper is 4} as a subset of S.(c) (5 points) Find P(E)(d) (5 points) Let F = {the larger minus the smaller number is 0}. What is P(F )?(e) (5 points) Are E and F disjoint? Why or why not?(f) (5 points) Find P(E ∪ F )arrow_forward
- In addition to the in-school milk supplement program, the nurse would like to increase the use of daily vitamin supplements for the children by visiting homes and educating about the merits of vitamins. She believes that currently, about 50% of families with school-age children give the children a daily megavitamin. She would like to increase this to 70%. She plans a two-group study, where one group serves as a control and the other group receives her visits. How many families should she expect to visit to have 80% power of detecting this difference? Assume that drop-out rate is 5%.arrow_forwardA recent survey of 400 americans asked whether or not parents do too much for their young adult children. The results of the survey are shown in the data file. a) Construct the frequency and relative frequency distributions. How many respondents felt that parents do too much for their adult children? What proportion of respondents felt that parents do too little for their adult children? b) Construct a pie chart. Summarize the findingsarrow_forwardThe average number of minutes Americans commute to work is 27.7 minutes (Sterling's Best Places, April 13, 2012). The average commute time in minutes for 48 cities are as follows: Click on the datafile logo to reference the data. DATA file Albuquerque 23.3 Jacksonville 26.2 Phoenix 28.3 Atlanta 28.3 Kansas City 23.4 Pittsburgh 25.0 Austin 24.6 Las Vegas 28.4 Portland 26.4 Baltimore 32.1 Little Rock 20.1 Providence 23.6 Boston 31.7 Los Angeles 32.2 Richmond 23.4 Charlotte 25.8 Louisville 21.4 Sacramento 25.8 Chicago 38.1 Memphis 23.8 Salt Lake City 20.2 Cincinnati 24.9 Miami 30.7 San Antonio 26.1 Cleveland 26.8 Milwaukee 24.8 San Diego 24.8 Columbus 23.4 Minneapolis 23.6 San Francisco 32.6 Dallas 28.5 Nashville 25.3 San Jose 28.5 Denver 28.1 New Orleans 31.7 Seattle 27.3 Detroit 29.3 New York 43.8 St. Louis 26.8 El Paso 24.4 Oklahoma City 22.0 Tucson 24.0 Fresno 23.0 Orlando 27.1 Tulsa 20.1 Indianapolis 24.8 Philadelphia 34.2 Washington, D.C. 32.8 a. What is the mean commute time for…arrow_forward
arrow_back_ios
SEE MORE QUESTIONS
arrow_forward_ios
Recommended textbooks for you
 Glencoe Algebra 1, Student Edition, 9780079039897...AlgebraISBN:9780079039897Author:CarterPublisher:McGraw Hill
 Big Ideas Math A Bridge To Success Algebra 1: Stu...AlgebraISBN:9781680331141Author:HOUGHTON MIFFLIN HARCOURTPublisher:Houghton Mifflin Harcourt
 Holt Mcdougal Larson Pre-algebra: Student Edition...AlgebraISBN:9780547587776Author:HOLT MCDOUGALPublisher:HOLT MCDOUGAL
 College Algebra (MindTap Course List)AlgebraISBN:9781305652231Author:R. David Gustafson, Jeff HughesPublisher:Cengage Learning
Glencoe Algebra 1, Student Edition, 9780079039897...
Algebra
ISBN:9780079039897
Author:Carter
Publisher:McGraw Hill
Big Ideas Math A Bridge To Success Algebra 1: Stu...
Algebra
ISBN:9781680331141
Author:HOUGHTON MIFFLIN HARCOURT
Publisher:Houghton Mifflin Harcourt
Holt Mcdougal Larson Pre-algebra: Student Edition...
Algebra
ISBN:9780547587776
Author:HOLT MCDOUGAL
Publisher:HOLT MCDOUGAL
College Algebra (MindTap Course List)
Algebra
ISBN:9781305652231
Author:R. David Gustafson, Jeff Hughes
Publisher:Cengage Learning
Correlation Vs Regression: Difference Between them with definition & Comparison Chart; Author: Key Differences;https://www.youtube.com/watch?v=Ou2QGSJVd0U;License: Standard YouTube License, CC-BY
Correlation and Regression: Concepts with Illustrative examples; Author: LEARN & APPLY : Lean and Six Sigma;https://www.youtube.com/watch?v=xTpHD5WLuoA;License: Standard YouTube License, CC-BY