Videos
Program to displays the score with each click and the total score in series
Program plan:
- Import the required packages
- In the “main()” function,
- Create the object of “GraphWin()”.
- Set the coordinates by calling the function “setCoords()”
- Create an object named “c” and store the points
- The outline of the circle is set to “green4” color.
- The circle is filled with “white” color.
- The width of the circle is set with the use of function “setWidth()”.
- Draw the circle with the use of function “draw()”.
- Create an object named “c2” and store the points
- The outline of the circle is set to “green4” color.
- The circle is filled with “red” color.
- The width of the circle is set with the use of function “setWidth()”.
- Draw the circle with the use of function “draw()”.
- Create an object named “c3” and store the points
- The outline of the circle is set to “green4” color.
- The circle is filled with “blue” color.
- The width of the circle is set with the use of function “setWidth()”.
- Draw the circle with the use of function “draw()”.
- Create an object named “c4” and store the points
- The outline of the circle is set to “green4” color.
- The circle is filled with “black” color.
- The width of the circle is set with the use of function “setWidth()”.
- Draw the circle with the use of function “draw()”.
- Create an object named “c5” and store the points
- The outline of the circle is set to “green4” color.
- The circle is filled with “white” color.
- The width of the circle is set with the use of function “setWidth()”.
- Draw the circle with the use of function “draw()”.
- Initialize a for loop to get the value of the points.
- Get the points where the mouse is clicked and store it in variable “arrow”.
- Derive the x-coordinate with the use of “getX()” function.
- Derive the x-coordinate with the use of “getY()” function.
- Calculate the value derived out of the equation and store in “z”.
- If the z-value is less than or equal to 5 and greater than 4 then,
- “y” is assigned with “1”
- “sum” is added with the value of “y”.
- If the z-value is less than or equal to 4 and greater than 3 then,
- “y” is assigned with “3”
- “sum” is added with the value of “y”.
- If the z-value is less than or equal to 3 and greater than 2 then,
- “y” is assigned with “5”
- “sum” is added with the value of “y”.
- If the z-value is less than or equal to 2 and greater than 1 then,
- “y” is assigned with “7”
- “sum” is added with the value of “y”.
- If the z-value is less than 1 then,
- “y” is assigned with “9”
- “sum” is added with the value of “y”.
- otherwise,
- “y” is assigned with “0”
- print the output statement.
- Print the value stored in “y” and “sum”.
- Call the function “main()”.
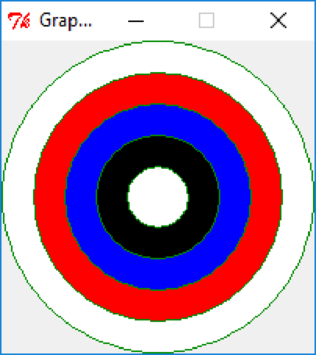
This program displays score achieved with each click in an archery board and also calculates and displays the sum of the entire series of outputs.
Explanation of Solution
Program:
#import the required packages
from graphics import *
import math as m
#define the main() function
def main():
#declare the required variables
win = GraphWin()
#set the coordinates
win.setCoords(-5, -5, 5, 5)
#draw the circle with specified points
c = Circle(Point(0,0), 5)
#set the outline of the circle
c.setOutline("green4")
#fill the circle with the colour
c.setFill("white")
#set the width of the circle
c.setWidth(1)
#draw the circle
c.draw(win)
#draw the circle with specified points
c2 = Circle(Point(0,0), 4)
#set the outline of the circle
c2.setOutline("green4")
#fill the circle with the colour
c2.setFill("red")
#set the width of the circle
c2.setWidth(1)
#draw the circle
c2.draw(win)
#draw the circle with specified points
c3 = Circle(Point(0,0), 3)
#set the outline of the circle
c3.setOutline("green4")
#fill the circle with the colour
c3.setFill("blue")
#set the width of the circle
c3.setWidth(1)
#draw the circle
c3.draw(win)
#draw the circle with specified points
c4 = Circle(Point(0,0), 2)
#set the outline of the circle
c4.setOutline("green4")
#fill the circle with the colour
c4.setFill("black")
#set the width of the circle
c4.setWidth(1)
#draw the circle
c4.draw(win)
#draw the circle with specified points
c5 = Circle(Point(0,0), 1)
#set the outline of the circle
c5.setOutline("green4")
#fill the circle with the colour
c5.setFill("white")
#set the width of the circle
c5.setWidth(1)
#draw the circle
c5.draw(win)
#declare and initialize the variable
sum = 0
#initialize the loop for x less than 5
for x in range (5):
#get the locations where mouse is clicked
arrow = win.getMouse()
#stores the X coordinate
x = arrow.getX()
#stores the Y coordinate
y = arrow.getY()
#calculate and store the value
z = m.sqrt(x ** 2 + y ** 2)
#condition for z to be less than or equal to 5 and greater than 4
if 5 >= z > 4:
#declare the variable
y = 1
#calculate the value of sum
sum = y + sum
#condition for z to be less than or equal to 4 and greater than 3
elif 4 >= z > 3:
#declare the variable
y = 3
#calculate the value of sum
sum = y + sum
#condition for z to be less than or equal to 3 and greater than 2
elif 3 >= z > 2:
#declare the variable
y = 5
#calculate the value of sum
sum = y + sum
#condition for z to be less than or equal to 2 and greater than 1
elif 2 >= z > 1:
#declare the variable
y = 7
#calculate the value of sum
sum = y + sum
#condition for z to be less than 1
elif 1 > z:
#declare the variable
y = 9
#calculate the value of sum
sum = y + sum
#else statement
else:
#declare the variable
y = 0
#print the statement
print("You missed!")
#print the statement
print("Point: {0} Total: {1}".format(y, sum))
#call the main() function
main()
Output:
Screenshot of output
Want to see more full solutions like this?
Chapter 7 Solutions
Python Programming: An Introduction to Computer Science, 3rd Ed.


- 2:21 m Ο 21% AlmaNet WE ARE HIRING Experienced Freshers Salesforce Platform Developer APPLY NOW SEND YOUR CV: Email: hr.almanet@gmail.com Contact: +91 6264643660 Visit: www.almanet.in Locations: India, USA, UK, Vietnam (Remote & Hybrid Options Available)arrow_forwardProvide a detailed explanation of the architecture on the diagramarrow_forwardhello please explain the architecture in the diagram below. thanks youarrow_forward
- Complete the JavaScript function addPixels () to calculate the sum of pixelAmount and the given element's cssProperty value, and return the new "px" value. Ex: If helloElem's width is 150px, then calling addPixels (hello Elem, "width", 50) should return 150px + 50px = "200px". SHOW EXPECTED HTML JavaScript 1 function addPixels (element, cssProperty, pixelAmount) { 2 3 /* Your solution goes here *1 4 } 5 6 const helloElem = document.querySelector("# helloMessage"); 7 const newVal = addPixels (helloElem, "width", 50); 8 helloElem.style.setProperty("width", newVal); [arrow_forwardSolve in MATLABarrow_forwardHello please look at the attached picture. I need an detailed explanation of the architecturearrow_forward
- Information Security Risk and Vulnerability Assessment 1- Which TCP/IP protocol is used to convert the IP address to the Mac address? Explain 2-What popular switch feature allows you to create communication boundaries between systems connected to the switch3- what types of vulnerability directly related to the programmer of the software?4- Who ensures the entity implements appropriate security controls to protect an asset? Please do not use AI and add refrencearrow_forwardFind the voltage V0 across the 4K resistor using the mesh method or nodal analysis. Note: I have already simulated it and the value it should give is -1.714Varrow_forwardResolver por superposicionarrow_forward
- Describe three (3) Multiplexing techniques common for fiber optic linksarrow_forwardCould you help me to know features of the following concepts: - commercial CA - memory integrity - WMI filterarrow_forwardBriefly describe the issues involved in using ATM technology in Local Area Networksarrow_forward
 C++ for Engineers and ScientistsComputer ScienceISBN:9781133187844Author:Bronson, Gary J.Publisher:Course Technology Ptr
 C++ Programming: From Problem Analysis to Program...Computer ScienceISBN:9781337102087Author:D. S. MalikPublisher:Cengage Learning
 Programming Logic & Design ComprehensiveComputer ScienceISBN:9781337669405Author:FARRELLPublisher:Cengage
 EBK JAVA PROGRAMMINGComputer ScienceISBN:9781337671385Author:FARRELLPublisher:CENGAGE LEARNING - CONSIGNMENT
 Microsoft Visual C#Computer ScienceISBN:9781337102100Author:Joyce, Farrell.Publisher:Cengage Learning,
 Programming with Microsoft Visual Basic 2017Computer ScienceISBN:9781337102124Author:Diane ZakPublisher:Cengage Learning