
Concept explainers
Videos
(a)
To Find: The display of the in the histogram and then describe the shape of the distribution.
(a)
Answer to Problem 11CR
The histogram is shown in Figure 1 majority of the data is on the left and the tail of the graph extends to the right this shows that the distribution is skewed to the right.
Given:
The given diagram is shown in Table 1
Table 1
| Amount | Frequency |
| 0-0.99 | 9 |
| 1-1.9 | 10 |
| 2-2.99 | 9 |
| 3-3.99 | 7 |
| 4-4.99 | 4 |
| 5-5.99 | 1 |
Calculation:
From the data shown in table1 the bar graph for the data shown is shown in Figure 1
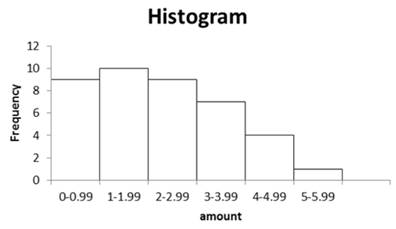
Figure 2
The majority of the data is on the left and the tail of the graph extends to the right this shows that the distribution is skewed to the right.
(b)
To Find: The measure for the centre and the variation that best represent the data.
The median is used to determine the centre and use the five number summary to determine the variation.
The distribution of the figure 1 shows that it is skewed and the median is used to determine the centre and use the five number summary to determine the variation.
(c)
To Find: The comparison of the distribution with the distribution given and use the shapes and the appropriate measure of the centre and variation.
The adults typically have more money in the pockets and amount may vary.
Given:
The given diagram is shown in Figure 2
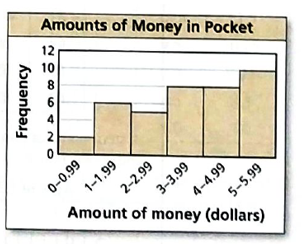
Figure 2
Calculation:
The distribution is skewed to the right and the majority of the data is on the left, since the tail of the graph extends to the right this shows that the median is used to determine the centre and use the five number summary to determine the variation.
Thus, the adults typically have more money in the pockets and amount may vary.
Explanation of Solution
Given:
The given diagram is shown in Table 1
Table 1
| Amount | Frequency |
| 0-0.99 | 9 |
| 1-1.9 | 10 |
| 2-2.99 | 9 |
| 3-3.99 | 7 |
| 4-4.99 | 4 |
| 5-5.99 | 1 |
Calculation:
From the data shown in table1 the bar graph for the data shown is shown in Figure 1
Figure 2
The majority of the data is on the left and the tail of the graph extends to the right this shows that the distribution is skewed to the right.
(b)
To Find: The measure for the centre and the variation that best represent the data.
(b)
Answer to Problem 11CR
The median is used to determine the centre and use the five number summary to determine the variation.
The distribution of the figure 1 shows that it is skewed and the median is used to determine the centre and use the five number summary to determine the variation.
(c)
To Find: The comparison of the distribution with the distribution given and use the shapes and the appropriate measure of the centre and variation.
The adults typically have more money in the pockets and amount may vary.
Given:
The given diagram is shown in Figure 2
Figure 2
Calculation:
The distribution is skewed to the right and the majority of the data is on the left, since the tail of the graph extends to the right this shows that the median is used to determine the centre and use the five number summary to determine the variation.
Thus, the adults typically have more money in the pockets and amount may vary.
Explanation of Solution
The distribution of the figure 1 shows that it is skewed and the median is used to determine the centre and use the five number summary to determine the variation.
(c)
To Find: The comparison of the distribution with the distribution given and use the shapes and the appropriate measure of the centre and variation.
(c)
Answer to Problem 11CR
The adults typically have more money in the pockets and amount may vary.
Given:
The given diagram is shown in Figure 2
Figure 2
Calculation:
The distribution is skewed to the right and the majority of the data is on the left, since the tail of the graph extends to the right this shows that the median is used to determine the centre and use the five number summary to determine the variation.
Thus, the adults typically have more money in the pockets and amount may vary.
Explanation of Solution
Given:
The given diagram is shown in Figure 2
Figure 2
Calculation:
The distribution is skewed to the right and the majority of the data is on the left, since the tail of the graph extends to the right this shows that the median is used to determine the centre and use the five number summary to determine the variation.
Thus, the adults typically have more money in the pockets and amount may vary.
Chapter 7 Solutions
BIG IDEAS MATH Integrated Math 1: Student Edition 2016


- ם Hwk 25 Hwk 25 - (MA 244-03) (SP25) || X Answered: [) Hwk 25 Hwk 28 - (X + https://www.webassign.net/web/Student/Assignment-Responses/last?dep=36606604 3. [1.14/4 Points] DETAILS MY NOTES LARLINALG8 6.4.013. Let B = {(1, 3), (-2, -2)} and B' = {(−12, 0), (-4, 4)} be bases for R², and let 42 - [13] A = 30 be the matrix for T: R² R² relative to B. (a) Find the transition matrix P from B' to B. 6 4 P = 9 4 (b) Use the matrices P and A to find [v] B and [T(V)] B, where [v]B[31]. 26 [V] B = -> 65 234 [T(V)]B= -> 274 (c) Find P-1 and A' (the matrix for T relative to B'). -1/3 1/3 - p-1 = -> 3/4 -1/2 ↓ ↑ -1 -1.3 A' = 12 8 ↓ ↑ (d) Find [T(v)] B' two ways. 4.33 [T(v)]BP-1[T(v)]B = 52 4.33 [T(v)]B' A'[V]B' = 52 目 67% PREVIOUS ANSWERS ill ASK YOUR TEACHER PRACTICE ANOTHERarrow_forward[) Hwk 25 Hwk 28 - (MA 244-03) (SP25) || X Success Confirmation of Questic X + https://www.webassign.net/web/Student/Assignment-Responses/submit?dep=36606607&tags=autosave#question 384855 DETAILS MY NOTES LARLINALG8 7.2.001. 1. [-/2.85 Points] Consider the following. -14 60 A = [ -4-5 P = -3 13 -1 -1 (a) Verify that A is diagonalizable by computing P-1AP. P-1AP = 具首 (b) Use the result of part (a) and the theorem below to find the eigenvalues of A. Similar Matrices Have the Same Eigenvalues If A and B are similar n x n matrices, then they have the same eigenvalues. (11, 12) = Need Help? Read It SUBMIT ANSWER 2. [-/2.85 Points] DETAILS MY NOTES LARLINALG8 7.2.007. For the matrix A, find (if possible) a nonsingular matrix P such that P-1AP is diagonal. (If not possible, enter IMPOSSIBLE.) P = A = 12 -3 -4 1 Verify that P-1AP is a diagonal matrix with the eigenvalues on the main diagonal. P-1AP = Need Help? Read It Watch It SUBMIT ANSWED 80% ill จ ASK YOUR TEACHER PRACTICE ANOTHER ASK YOUR…arrow_forward[) Hwk 25 → C Hwk 27 - (MA 244-03) (SP25) IN X Answered: [) Hwk 25 4. [-/4 Poir X + https://www.webassign.net/web/Student/Assignment-Responses/submit?dep=36606606&tags=autosave#question3706544_6 3. [-/2.85 Points] DETAILS MY NOTES LARLINALG8 7.1.021. Find the characteristic equation and the eigenvalues (and a basis for each of the corresponding eigenspaces) of the matrix. 2 -2 5 0 3 -2 0-1 2 (a) the characteristic equation (b) the eigenvalues (Enter your answers from smallest to largest.) (1, 2, 13) = ·( ) a basis for each of the corresponding eigenspaces X1 x2 = x3 = Need Help? Read It Watch It SUBMIT ANSWER 4. [-/2.85 Points] DETAILS MY NOTES LARLINALG8 7.1.041. Find the eigenvalues of the triangular or diagonal matrix. (Enter your answers as a comma-separated list.) λ= 1 0 1 045 002 Need Help? Read It ASK YOUR TEACHER PRACTICE ANOTHER ASK YOUR TEACHER PRACTICE ANOTHER illarrow_forward
- [) Hwk 25 4. [-/4 Points] Hwk 25 - (MA 244-03) (SP25) || X Answered: Homework#7 | bartle X + https://www.webassign.net/web/Student/Assignment-Responses/last?dep=36606604 DETAILS MY NOTES LARLINALG8 6.4.019. Use the matrix P to determine if the matrices A and A' are similar. -1 -1 12 9 '-[ ¯ ¯ ], ^ - [ _—2—2 _ ' ], ^' - [ ˜³ −10] P = 1 2 A = -20-11 A' -3-10 6 4 P-1 = Are they similar? Yes, they are similar. No, they are not similar. Need Help? Read It SUBMIT ANSWER P-1AP = 5. [-/4 Points] DETAILS MY NOTES LARLINALG8 6.4.023. Suppose A is the matrix for T: R³ - → R³ relative to the standard basis. Find the diagonal matrix A' for T relative to the basis B'. A' = -1 -2 0 A = -1 0 0 ' 0 02 B' = {(−1, 1, 0), (2, 1, 0), (0, 0, 1)} ☐☐☐ ↓ ↑ Need Help? Read It Update available →] - restart now ASK YOUR T Sync and save data { Sign In ill ↑ New tab HT New window N New private window +HP ASK YOUR T Bookmarks History Downloads > > HJ Passwords Add-ons and themes HA Print... HP Save page as... HS…arrow_forwardClarification: 1. f doesn’t have REAL roots2. f is a quadratic, so a≠0arrow_forward[J) Hwk 25 Hwk 25 - (MA 244-03) (SP25) || X Answered: Homework#7 | bartle X + https://www.webassign.net/web/Student/Assignment-Responses/last?dep=36606604 1. [-/4 Points] DETAILS MY NOTES Find the matrix A' for T relative to the basis B'. LARLINALG8 6.4.003. T: R² → R², T(x, y) = (x + y, 4y), B' = {(−4, 1), (1, −1)} A' = Need Help? Read It Watch It SUBMIT ANSWER 2. [-/4 Points] DETAILS MY NOTES LARLINALG8 6.4.007. Find the matrix A' for T relative to the basis B'. T: R³ → R³, T(x, y, z) = (x, y, z), B' = {(0, 1, 1), (1, 0, 1), (1, 1, 0)} A' = ↓ ↑ Need Help? Read It SUBMIT ANSWER 具⇧ ASK YOUR TEACHER PRACTICE ANOTHER ill ASK YOUR TEACHER PRACTICE ANOTHER 3. [-/4 Points] DETAILS MY NOTES LARLINALG8 6.4.013. ASK YOUR TEACHER PRACTICE ANOTHERarrow_forward
- Use Laplace transforms to solve the following heat problem: U₁ = Urr x > 0, t> 0 u(x, 0) = 10c a -X u(0,t) = 0 lim u(x,t) = 0 I7Xarrow_forwarda/ Solve the equation Laplac transfors wt = wxx W (X10)=0 w (o,t) = f (t) lim wexit) = 0 *>° t>o , to t70 848arrow_forwardQ/ Find the Fourier sine and cosine trans forms of f(x) = e-cxarrow_forward
 Advanced Engineering MathematicsAdvanced MathISBN:9780470458365Author:Erwin KreyszigPublisher:Wiley, John & Sons, Incorporated
 Numerical Methods for EngineersAdvanced MathISBN:9780073397924Author:Steven C. Chapra Dr., Raymond P. CanalePublisher:McGraw-Hill Education
 Introductory Mathematics for Engineering Applicat...Advanced MathISBN:9781118141809Author:Nathan KlingbeilPublisher:WILEY
 Mathematics For Machine TechnologyAdvanced MathISBN:9781337798310Author:Peterson, John.Publisher:Cengage Learning,
