
Concept explainers
a)
To establish: Upper and lower control limits for the control chart and graph the data.
Introduction: Control charts used to determine whether the process is under control or not. Attributes and variables are the factors under the control charts.
a)
Answer to Problem 20P
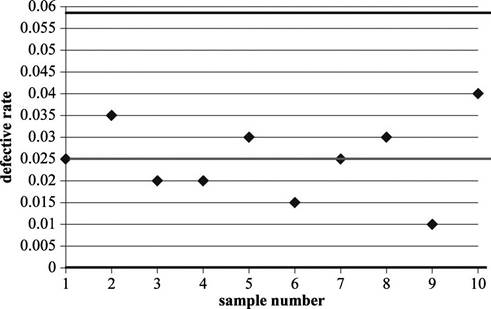
The upper control limit is 0.05812 and lower control limit is 0.
Explanation of Solution
Given information:
The following information is given:
| Sample | 1 | 2 | 3 | 4 | 5 | 6 | 7 | 8 | 9 | 10 |
| Defectives | 5 | 7 | 4 | 4 | 6 | 3 | 5 | 6 | 2 | 8 |
Compute the defective rate
Defective rate is calculated by dividing the sum of defectives and multiple of number of samples and
Determine
Sample size is given as 200 and the defective rate is calculated as 0.025. Substitute the values in above equation. Hence, the standard deviation is 0.01104.
Determine UCL:
It can be calculated by adding the defective rate with the value attained by multiplying the number of standard deviation for setting the limit and standard deviation of the sampling distribution.
Hence, the UCL value is 0.05812.
Determine LCL:
It can be calculated by subtracting the defective rate with the value attained by multiplying the number of standard deviation for setting the limit and standard deviation of the sampling distribution.
Hence, the LCL value is 0.
Draw a p-chart for the attained values:
b)
To determine: Whether the process been in control.
Introduction: Control charts used to determine whether the process is under control or not. Attributes and variables are the factors under the control charts.
b)
Answer to Problem 20P
The process been in control.
Explanation of Solution
Given information:
The following information is given:
| Sample | 1 | 2 | 3 | 4 | 5 | 6 | 7 | 8 | 9 | 10 |
| Defectives | 5 | 7 | 4 | 4 | 6 | 3 | 5 | 6 | 2 | 8 |
Determine whether the process in control:
Since all the values are within the upper and lower control limits, the process seems to be in control.
The last two samples, sample number #9 and sample number #10 are showing a wider dispersion from the center line. Further samples need to be drawn and verified whether the defective rates increase in dispersion.
c)
To establish: Upper and lower control limits for the control chart and graph the data, if the sample size were 100.
Introduction: Control charts used to determine whether the process is under control or not. Attributes and variables are the factors under the control charts.
c)
Answer to Problem 20P
The upper control limit is 0.11537 and lower control limit is 0.
Explanation of Solution
Given information:
The following information is given:
| Sample | 1 | 2 | 3 | 4 | 5 | 6 | 7 | 8 | 9 | 10 |
| Defectives | 5 | 7 | 4 | 4 | 6 | 3 | 5 | 6 | 2 | 8 |
Compute the defective rate
Defective rate is calculated by dividing the sum of defectives and multiple of number of samples and sample size. Hence, the defective rate is 0.05.
Determine
Sample size is given as 100 and the defective rate is calculated as 0.05. Substitute the values in above equation. Hence, the standard deviation is 0.02179.
Determine UCL:
It can be calculated by adding the defective rate with the value attained by multiplying the number of standard deviation for setting the limit and standard deviation of the sampling distribution.
Hence, the UCL value is 0.11537.
Determine LCL:
It can be calculated by subtracting the defective rate with the value attained by multiplying the number of standard deviation for setting the limit and standard deviation of the sampling distribution.
Hence, the LCL value is 0.
Draw a p-chart for the attained values:
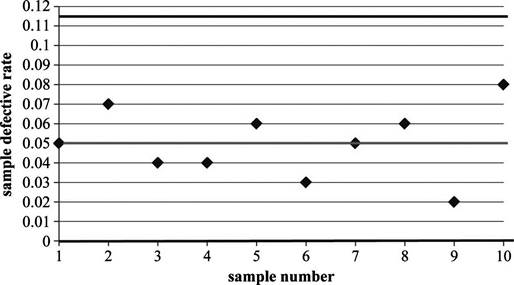
Since all the values are within the upper and lower control limits, the process seems to be in control. This is expected, as the observations were within the limits even when the limits were narrower.
Want to see more full solutions like this?
Chapter 6 Solutions
EBK PRINCIPLES OF OPERATIONS MANAGEMENT


- Do you think there are other methods to achieve efficiency, such as specialization or using technology to alleviate the bottleneck, like patient wait time?arrow_forwardIs it hard to improve efficiency in a process? Why or why not? Give an example of how to improve the efficiency of a process. Please provide a reference in APA formarrow_forwardSimplex Method Three types of paints are manufactured in one machine; Interior paint, Exterior paint and Paint for metal structures. The preparation time for each type of paint is 2, 3 and 4 minutes respectively and the processing time is 3, 2 and 1 minute. The profit contributed by each product is 12, 10 and 15 dollars respectively. The machine availability is 100 minutes and 200 minutes for machine setup. 1. Determine the optimum number of types of paints to be manufactured. 2. Determine the optimal utility value.arrow_forward
- The company LED S.A DE C.V. produces 2 devices for lamps, devices 1 and 2 that require metal parts and electrical parts. The manager wants to determine how many units of each product should be manufactured to maximize the profit for each unit, device 1 requires 2 metal parts and 4 electrical parts, device 2 requires 4 metal parts and 2 electrical parts, the company has 24 units of each material available for batch production, device 1 generates $4 profit and device 2 generates $6 profit. a) Formulate PL model. b) Solve by the graphical method and determine what is the resulting maximum profit. Translated with DeepL.com (free version)arrow_forwardQuestion 3 i. Using the Center of Gravity method, determine the optimal location (X, Y) for the new distribution center. [7 marks] [TOTAL 25 MARKS] Time (sec.) Power steering assembly firm wants to set up an assembly line which must have an output of 60 units per hour. The work elements, task times and their precedence relationships are shown in Table 2: Table 1 Work Element Immediate Predecessor(s) A 30 NONE B 26 A C 50 A D 44 B E 10 с F 20 с G 15 D.E H 30 E,G,F Required: a. Draw the precedence diagram showing the task precedence and their times b. Determine the cycle time associated with the rate of output required. [3 marks] c. What is the theoretical number of work stations required to satisfy this output rate? [3 marks] [4 marks] d. Allocate the tasks to work stations taking into consideration the precedence requirements and using the LOT rule to break ties between feasible tasks. e. Calculate the total idle time [8 marks] [3 marks] f. What is the efficiency of the line and the…arrow_forwardHyundai Motors is considering three sites-A, B, and C-at which to locate a factory to build its new electric car batteries. The goal is to locate at a minimum-cost site, where cost is measured by the annual fixed plus variable costs of production. Hyundai Motors has gathered the following data: Site Annualized Fixed Cost Variable Cost per Battery Produced A $11,000,000 $2,600 B C $2,000 $1,100 $20,000,000 $25,000,000 The firm knows it will produce between 0 and 60,000 batteries at the new plant each year, but, thus far, that is the extent of its knowledge about production plans. a) The value of volume, V, of production above which site C is recommended = batteries (round your response up to the next whole number).arrow_forward
- Hyundai Motors is considering three sites-A, B, and C-at which to locate a factory to build its new electric car batteries. The goal is to locate at a minimum-cost site, where cost is measured by the annual fixed plus variable costs of production. Hyundai Motors has gathered the following data: Site Annualized Fixed Cost Variable Cost per Battery Produced A $11,000,000 $2,500 B C $2,100 $1,050 $20,000,000 $25,000,000 The firm knows it will produce between 0 and 60,000 batteries at the new plant each year, but, thus far, that is the extent of its knowledge about production plans. a) The value of volume, V, of production above which site C is recommended = batteries (round your response up to the next whole number).arrow_forwardThe importance of keeping track of invoices and budgeting in a nursing home kitchen and how can a nutritionist utilize this in their career? Please not just a short explanation.arrow_forwardThe importance of interviewing potential food service aides and how can a nutritionist utilize this in their career? Please not just a short explanation.arrow_forward
- What role does job analysis and job evaluation play in the compensation decision? Give an example of an organization NO AIarrow_forwardI did the first half correct! Please help me with the second half, not quite sure of the naive approach. Thanks in advance!arrow_forwardBecause my tutor and I didnt get it rightarrow_forward
 Foundations of Business (MindTap Course List)MarketingISBN:9781337386920Author:William M. Pride, Robert J. Hughes, Jack R. KapoorPublisher:Cengage Learning
 Foundations of Business - Standalone book (MindTa...MarketingISBN:9781285193946Author:William M. Pride, Robert J. Hughes, Jack R. KapoorPublisher:Cengage Learning
 Practical Management ScienceOperations ManagementISBN:9781337406659Author:WINSTON, Wayne L.Publisher:Cengage,
 Management, Loose-Leaf VersionManagementISBN:9781305969308Author:Richard L. DaftPublisher:South-Western College Pub