Concept explainers
Cost Behaviour; High4æw Method; Contribution Format Income Statement LOS−10
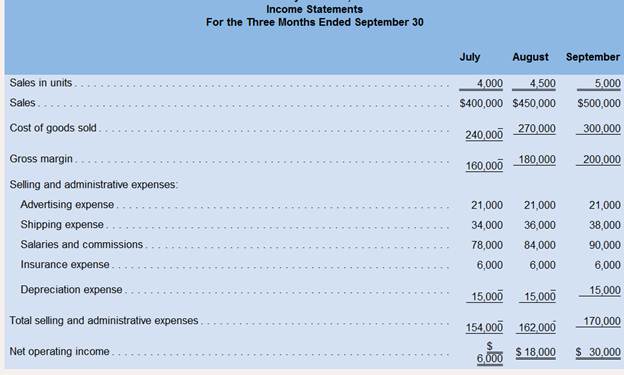
Morrisey& Brown, Ltd of Sydney j a merchandising company that is the sole distributor product that is increasing in popularity among Australian consumers, The Company’s income statements for the three most recent months follow:
Required:
1. By ana1vzm the data from the company’s income statements, classify each of its expenses (including cost of goods sold) as either variable, fixed, or mixed.
2. Using the high-low method, separate each mixed expense into variable and fixed elements. Express the variable and fed portions of each mixed expense in the form Y = a + bX.
3. Redo the company’s income statement at the 5,000-unit level of activity using the contribution format.
High−Low Method: It is one of the methods distribution of cost used to split the mixed cost into fixed cost and variable cost.
1. The classification of expenses into variable, fixed, or mixed from the data given in the income statement.
2. The variable and fixed elements from the mixed expenses using the high-low method.
3. The contribution format income statement at the 5,000 unit level of activity.
Answer to Problem 7P
Solution:
1.
| Expenses | Classification |
| Cost of goods sold | Variable |
| Advertising expenses | Fixed |
| Shipping expenses | Mixed |
| Salaries and commissions | Mixed |
| Insurance expense | Fixed |
| Depreciation expenses | Fixed |
2. The total cost equation for shipping expenses is
The total cost equation for Salaries and Commissions is
3.
| Morrisey & Brown, Ltd
Contribution Format Income Statement | ||
| Sales | $500,000 | |
| Variable expenses: | ||
| Cost of goods sold | $300,000 | |
| Shipping expenses | $20,000 | |
| Salaries and commissions | $60,000 | |
| Total variable expenses | $380,000 | |
| Contribution margin | $120,000 | |
| Fixed expenses: | ||
| Advertising expenses | $21,000 | |
| Shipping expenses | $18,000 | |
| Salaries and commissions | $30,000 | |
| Insurance expenses | $6,000 | |
| Depreciation expenses | $15,000 | |
| Total fixed expenses | $90,000 | |
| Net operating income | $30,000 | |
Explanation of Solution
1. If the total amount of any expenses does not changes at different level of sales, it is a fixed expenses and if the total amount of any expenses changes at different level of sales, it is a variable expenses or mixed expenses. The combination of fixed and variable expenses is called a mixed expense.
2.
Applying High-low method to Shipping expenses (Mixed expenses)
| Units | Shipping
Expenses | |
| High Activity level | 5,000 | $38,000 |
| Low Activity level | 4,000 | $34,000 |
| Change | 1,000 | $4,000 |
Computation of Fixed cost at highest level of activity
Applying High-low method to Salaries and commissions expenses (Mixed expenses)
| Units | Shipping
Expenses | |
| High Activity level | 5,000 | $90,000 |
| Lowest Activity level | 4,000 | $78,000 |
| Change | 1,000 | $12,000 |
Computation of fixed cost at highest level of activity
3. The mixed expenses are distributed according to the variable and fixed elements based upon the figures computed by High-low Method. The variable expenses are $4 for shipping expenses and $12 for salaries and commissions. The fixed expenses are $18,000 for shipping expenses and $30,000 for salaries and commissions. The fixed expenses and variable expenses per unit will always remain the same for any level of sale.
Given:
| Morrisey & Brown, Ltd.
Income Statements For the Three Ended September 30 | |||
| Sales units | 4,000 | 4,500 | 5,000 |
| Sales | $400,000 | $450,000 | $500,000 |
| Cost of goods sold | $240,000 | $270,000 | $300,000 |
| Gross margin | $160,000 | $180,000 | $200,000 |
| Selling and administrative expenses: | |||
| Advertising expenses | $21,000 | $21,000 | $21,000 |
| Shipping expenses | $34,000 | $36,000 | $38,000 |
| Salaries and commissions | $78,000 | $84,000 | $90,000 |
| Insurance expenses | $6,000 | $6,000 | $6,000 |
| Depreciation expenses | $15,000 | $15,000 | $15,000 |
| Total selling and administrative expenses | $154,000 | $162,000 | $170,000 |
| Net operating income | $6,000 | $18,000 | $30,000 |
It is concluded that the Morrisey & Brown, have two mixed expenses which are shipping expenses and salaries expenses. A mixed expense can be identified by finding the change in percentage of the expense. Usually a variable expenses changes according to the change in the sales. So it means that the percentage change in sales will always be equal to percentage change in variable expenses. Hence if the percentage change in an expense is not equal to percentage change in sales, it is known as a mixed expenses.
Want to see more full solutions like this?
Chapter 6 Solutions
Introduction To Managerial Accounting
- 9. If a company fails to adjust for accrued interest expense, what is the effect on the financial statements?A. Assets overstatedB. Liabilities understatedC. Revenues understatedD. Equity overstated need helllparrow_forward9. If a company fails to adjust for accrued interest expense, what is the effect on the financial statements?A. Assets overstatedB. Liabilities understatedC. Revenues understatedD. Equity overstatedarrow_forwardDont use chatgpt The journal entry to record the purchase of office supplies on account would include:A. Debit Supplies, Credit CashB. Debit Supplies, Credit Accounts PayableC. Debit Cash, Credit SuppliesD. Debit Accounts Payable, Credit Suppliesarrow_forward
- Can you help me solve this general accounting problem using the correct accounting process?arrow_forwardPlease help me solve this general accounting question using the right accounting principles.arrow_forwardNo use Ai The journal entry to record the purchase of office supplies on account would include:A. Debit Supplies, Credit CashB. Debit Supplies, Credit Accounts PayableC. Debit Cash, Credit SuppliesD. Debit Accounts Payable, Credit Suppliesarrow_forward
- The journal entry to record the purchase of office supplies on account would include:A. Debit Supplies, Credit CashB. Debit Supplies, Credit Accounts PayableC. Debit Cash, Credit SuppliesD. Debit Accounts Payable, Credit Supplies need helparrow_forwardI am looking for help with this general accounting question using proper accounting standards.arrow_forwardI need help solving this general accounting question with the proper methodology.arrow_forward
 Cornerstones of Financial AccountingAccountingISBN:9781337690881Author:Jay Rich, Jeff JonesPublisher:Cengage LearningPrinciples of Accounting Volume 2AccountingISBN:9781947172609Author:OpenStaxPublisher:OpenStax College
 Financial Reporting, Financial Statement Analysis...FinanceISBN:9781285190907Author:James M. Wahlen, Stephen P. Baginski, Mark BradshawPublisher:Cengage Learning
 Managerial AccountingAccountingISBN:9781337912020Author:Carl Warren, Ph.d. Cma William B. TaylerPublisher:South-Western College Pub
 Financial And Managerial AccountingAccountingISBN:9781337902663Author:WARREN, Carl S.Publisher:Cengage Learning,


