
Concept explainers
Videos
New Residences The average number of moves a person makes in his or her lifetime is 12. If the standard deviation is 3.2, find the
a. Less than 10
b. Greater than 10
c. Between 11 and 12
a.
To obtain: The probability that a random sample of 36 people is less than 10.
Answer to Problem 9E
The probability that a random sample of 36 people is less than 10 is 0.00009.
Explanation of Solution
Given info:
Average number of moves a person makes in his or her lifetime is
Calculations:
The random variable x represents number of moves of a person in his/her lifetime.
The notation
The formula for finding the z score using central limit theorem is,
Substitute 10 for
The probability that the mean of the selected sample will be less than 10 moves represents the area to the left of 3.75.
Software procedure:
Step-by-step procedure to obtain the probability using the MINITAB software:
- Choose Graph > Probability Distribution Plot choose View Probability> OK.
- From Distribution, choose ‘Normal’ distribution.
- Enter the Mean as 0.0 and Standard deviation as 1.0.
- Click the Shaded Area tab.
- Choose X value and Left Tail for the region of the curve to shade.
- Enter the X value as –3.75.
- Click OK.
- Output using the MINITAB software is given below:
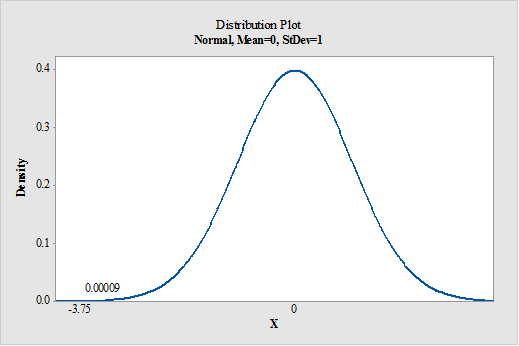
From MINITAB output, the probability that a random sample of 36 people is less than 10 is 0.00009.
- b.
To obtain: The probability that a random sample of 36 people is greater than 10.
Answer to Problem 9E
Probability will be 0.9999.
Explanation of Solution
Calculations:
The formula for finding the z score using central limit theorem is,
Substitute 10 for
The probability that a random sample of 36 people greater than 10 represents the area to the right of –3.75.
Software procedure:
Step-by-step procedure to obtain the probability using the MINITAB software:
- Choose Graph > Probability Distribution Plot choose View Probability> OK.
- From Distribution, choose ‘Normal’ distribution.
- Enter the Mean as 0.0 and Standard deviation as 1.0.
- Click the Shaded Area tab.
- Choose X value and Right Tail for the region of the curve to shade.
- Enter the X value as –3.75.
- Click OK.
- Output using the MINITAB software is given below:
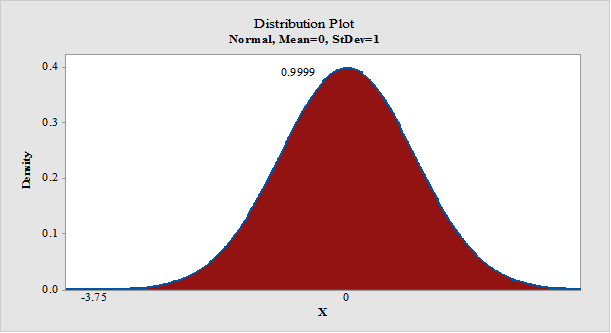
- From MINITAB output, the probability that a random sample of 36 people greater than 10 is 0.9999.
- c.
The probability that a random sample of 36 people between 11 and 12.
Answer to Problem 9E
The probability that a random sample of 36 people is between 11 and 12 is 0.4699.
Explanation of Solution
Calculations:
The formula for finding the z score using central limit theorem is,
Substitute 11 and 12 for
The probability that a random sample of 36 people is between 11 and 12 represents area between the value
Software procedure:
Step-by-step procedure to obtain the probability using the MINITAB software:
- Choose Graph > Probability Distribution Plot choose View Probability> OK.
- From Distribution, choose ‘Normal’ distribution.
- Enter the Mean as 0.0 and Standard deviation as 1.0.
- Click the Shaded Area tab.
- Choose X value and Middle for the region of the curve to shade.
- Enter the X value 1 as –1.88 and X value 2 as 0.
- Click OK.
- Output using the MINITAB software is given below:
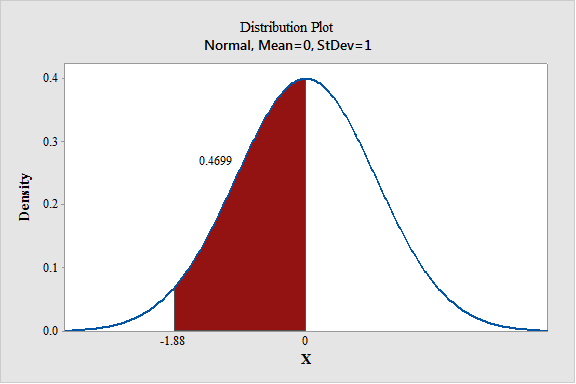
From MINITAB output, the probability that a random sample of 36 people is between 11 and 12 is 0.4699.
Want to see more full solutions like this?
Chapter 6 Solutions
ELEMENTARY STATISTICS: STEP BY STEP- ALE


- An environmental research team is studying the daily rainfall (in millimeters) in a region over 100 days. The data is grouped into the following histogram bins: Rainfall Range (mm) Frequency 0-9.9 15 10 19.9 25 20-29.9 30 30-39.9 20 ||40-49.9 10 a) If a random day is selected, what is the probability that the rainfall was at least 20 mm but less than 40 mm? b) Estimate the mean daily rainfall, assuming the rainfall in each bin is uniformly distributed and the midpoint of each bin represents the average rainfall for that range. c) Construct the cumulative frequency distribution and determine the rainfall level below which 75% of the days fall. d) Calculate the estimated variance and standard deviation of the daily rainfall based on the histogram data.arrow_forwardAn electronics company manufactures batches of n circuit boards. Before a batch is approved for shipment, m boards are randomly selected from the batch and tested. The batch is rejected if more than d boards in the sample are found to be faulty. a) A batch actually contains six faulty circuit boards. Find the probability that the batch is rejected when n = 20, m = 5, and d = 1. b) A batch actually contains nine faulty circuit boards. Find the probability that the batch is rejected when n = 30, m = 10, and d = 1.arrow_forwardTwenty-eight applicants interested in working for the Food Stamp program took an examination designed to measure their aptitude for social work. A stem-and-leaf plot of the 28 scores appears below, where the first column is the count per branch, the second column is the stem value, and the remaining digits are the leaves. a) List all the values. Count 1 Stems Leaves 4 6 1 4 6 567 9 3688 026799 9 8 145667788 7 9 1234788 b) Calculate the first quartile (Q1) and the third Quartile (Q3). c) Calculate the interquartile range. d) Construct a boxplot for this data.arrow_forward
- Pam, Rob and Sam get a cake that is one-third chocolate, one-third vanilla, and one-third strawberry as shown below. They wish to fairly divide the cake using the lone chooser method. Pam likes strawberry twice as much as chocolate or vanilla. Rob only likes chocolate. Sam, the chooser, likes vanilla and strawberry twice as much as chocolate. In the first division, Pam cuts the strawberry piece off and lets Rob choose his favorite piece. Based on that, Rob chooses the chocolate and vanilla parts. Note: All cuts made to the cake shown below are vertical.Which is a second division that Rob would make of his share of the cake?arrow_forwardThree players (one divider and two choosers) are going to divide a cake fairly using the lone divider method. The divider cuts the cake into three slices (s1, s2, and s3). If the choosers' declarations are Chooser 1: {s1 , s2} and Chooser 2: {s2 , s3}. Using the lone-divider method, how many different fair divisions of this cake are possible?arrow_forwardTheorem 2.6 (The Minkowski inequality) Let p≥1. Suppose that X and Y are random variables, such that E|X|P <∞ and E|Y P <00. Then X+YpX+Yparrow_forward
- Theorem 1.2 (1) Suppose that P(|X|≤b) = 1 for some b > 0, that EX = 0, and set Var X = 0². Then, for 0 0, P(X > x) ≤e-x+1²² P(|X|>x) ≤2e-1x+1²² (ii) Let X1, X2...., Xn be independent random variables with mean 0, suppose that P(X ≤b) = 1 for all k, and set oσ = Var X. Then, for x > 0. and 0x) ≤2 exp Σ k=1 (iii) If, in addition, X1, X2, X, are identically distributed, then P(S|x) ≤2 expl-tx+nt²o).arrow_forwardTheorem 5.1 (Jensen's inequality) state without proof the Jensen's Ineg. Let X be a random variable, g a convex function, and suppose that X and g(X) are integrable. Then g(EX) < Eg(X).arrow_forwardCan social media mistakes hurt your chances of finding a job? According to a survey of 1,000 hiring managers across many different industries, 76% claim that they use social media sites to research prospective candidates for any job. Calculate the probabilities of the following events. (Round your answers to three decimal places.) answer parts a-c. a) Out of 30 job listings, at least 19 will conduct social media screening. b) Out of 30 job listings, fewer than 17 will conduct social media screening. c) Out of 30 job listings, exactly between 19 and 22 (including 19 and 22) will conduct social media screening. show all steps for probabilities please. answer parts a-c.arrow_forward
- Question: we know that for rt. (x+ys s ا. 13. rs. and my so using this, show that it vye and EIXI, EIYO This : E (IX + Y) ≤2" (EIX (" + Ely!")arrow_forwardTheorem 2.4 (The Hölder inequality) Let p+q=1. If E|X|P < ∞ and E|Y| < ∞, then . |EXY ≤ E|XY|||X|| ||||qarrow_forwardTheorem 7.6 (Etemadi's inequality) Let X1, X2, X, be independent random variables. Then, for all x > 0, P(max |S|>3x) ≤3 max P(S| > x). Isk≤narrow_forward
 Glencoe Algebra 1, Student Edition, 9780079039897...AlgebraISBN:9780079039897Author:CarterPublisher:McGraw Hill
 Holt Mcdougal Larson Pre-algebra: Student Edition...AlgebraISBN:9780547587776Author:HOLT MCDOUGALPublisher:HOLT MCDOUGAL
 Big Ideas Math A Bridge To Success Algebra 1: Stu...AlgebraISBN:9781680331141Author:HOUGHTON MIFFLIN HARCOURTPublisher:Houghton Mifflin Harcourt