
Concept explainers
Videos
Applying the Concepts 6–3
Times To Travel to School
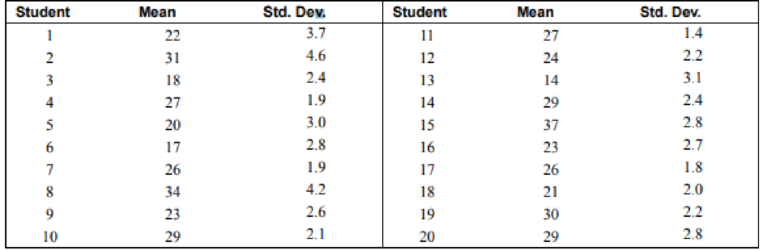
Twenty students from a statistics class each collected a random sample of times on how long it took students to get to class from their homes. All the sample sizes were 30. The resulting means are listed.
1. The students noticed that everyone had different answers. If you randomly sample over and over from any population, with the same
2. The students wondered whose results were right. How can they find out what the population
3. Input the means into the computer and check if the distribution is normal.
4. Check the mean and standard deviation of the means. How do these values compare to the students’ individual scores?
5. Is the distribution of the means a sampling distribution?
6. Check the sampling error for students 3, 7, and 14.
7. Compare the standard deviation of the sample of the 20 means. Is that equal to the standard deviation from student 3 divided by the square of the sample size? How about for student 7, or 14?
See page 368 for the answers.
1.
To check: Whether the result will be same when a random sample with same sample size is selected over and over from any population results in same mean.
Answer to Problem 1AC
No, the result will be same when a random sample with same sample size is selected over and over from any population results in same mean.
Explanation of Solution
Given info:
Twenty students each collected a random sample of times on how long it took students to get to class from their homes. Sample size is 30.
Justification:
Since, population is very large, and it’s very rare that the observations in each sample are same or close to each other. Also, it’s very rare event that samples from such a large population have same means. Therefore, the probability that different samples of same size have same means is approximately zero since that event is very rare. Thus, a random sample over and over from any population does not results in same mean.
2.
The method to find population mean and population standard deviation.
Answer to Problem 1AC
By taking average of all sample means and standard deviations.
Explanation of Solution
Given info:
Sample means and sample standard deviations of 20 samples.
Justification:
Since, sample means and sample standard deviations are given; therefore population mean can be estimated by taking average of all sample means.
Similarly, population standard deviation can be estimated by taking average of all given standard deviations.
3.
Whether the distribution is normal or not.
Answer to Problem 1AC
Given data is not normal.
Explanation of Solution
Given info:
Means of 30 samples are given.
Table:
| Students | Average time |
| 1 | 22 |
| 2 | 31 |
| 3 | 18 |
| 4 | 27 |
| 5 | 20 |
| 6 | 17 |
| 7 | 26 |
| 8 | 34 |
| 9 | 23 |
| 10 | 29 |
| 11 | 27 |
| 12 | 24 |
| 13 | 14 |
| 14 | 29 |
| 15 | 37 |
| 16 | 23 |
| 17 | 26 |
| 18 | 21 |
| 19 | 30 |
| 20 | 29 |
Software procedure:
Step-by-step procedure to obtain the histogram using the MINITAB software:
- Enter the given data in columns.
- Choose Graph > select Histogram > select with fit > select ok.
- Select the column of average time.
- Click OK.
Output using the MINITAB software is given below:

From MINITAB output, the data of 20 means is not normal but is highly negatively skewed.
4.
To find the mean and standard deviation of the sample means.
Answer to Problem 1AC
Mean and standard deviation of sample means is 25.4 and 5.8 resp.
Explanation of Solution
Given info:
Sample means and sample standard deviations of 20 samples of size 30 each are given in table.
Table:
| Students | Average time | Standard deviation |
| 1 | 22 | 3.7 |
| 2 | 31 | 4.6 |
| 3 | 18 | 2.4 |
| 4 | 27 | 1.9 |
| 5 | 20 | 3 |
| 6 | 17 | 2.8 |
| 7 | 26 | 1.9 |
| 8 | 34 | 4.2 |
| 9 | 23 | 2.6 |
| 10 | 29 | 2.1 |
| 11 | 27 | 1.4 |
| 12 | 24 | 2.2 |
| 13 | 14 | 3.1 |
| 14 | 29 | 2.4 |
| 15 | 37 | 2.8 |
| 16 | 23 | 2.7 |
| 17 | 26 | 1.8 |
| 18 | 21 | 2 |
| 19 | 30 | 2.2 |
| 20 | 29 | 2.8 |
Software procedure:
Step-by-step procedure to obtain the probability using the MINITAB software:
- Choose Stat > Basic Statistics > Display Descriptive Statistics.
- In Variables enter the columns Average time and StDev.
- Click OK.
Statistics

5.
Whether distribution of means is sampling distribution.
Answer to Problem 1AC
No.
Explanation of Solution
Given info:
Sample means and sample standard deviations of 20 samples of size 30 each.
Justification:
In given question each sample size is 30. Sampling distribution means that distribution of all possible samples of size 30 from the population. But, there are only 20 samples which are very less. Therefore, distribution of given sample means is not a sampling distribution.
6.
the standard error for 3rd, 7th and 14th students.
Answer to Problem 1AC
Standard errors of 3rd, 7th and 14th students are −7.4, 0.6 and 3.6 respectively.
Explanation of Solution
Given info:
Sample means for 3rd, 7th and 14th students are 18, 26, 29 respectively.
From part 4, mean of sample means is 25.4.
Calculation:
Let,
S represents mean of sample means.
S3 represents mean corresponding to 3rd student.
S7 represents mean corresponding to 7th student.
S14 represents mean corresponding to14th student.
Similarly,
The standard errors of 3rd, 7th and 14th students are −7.4, 0.6 and 3.6 respectively.
7.
Compare the standard deviation for 3rd, 7th and 14th students divided by sample size 30 with standard deviations of means.
Answer to Problem 1AC
Standard deviation of means is greater than standard deviation divided by square root of the sample size.
Explanation of Solution
Given Info:
Sample deviations for 3rd, 7th and 14th students.
From part 4, standard deviation of sample means is 5.8.
Sample size is 30.
Calculation:
SD represents the standard deviation of sample means.
SD3 represents the value obtained by dividing standard deviation of 3rd student divided by sample size.
SD7 represents the value obtained by dividing standard deviation of 7th student divided by sample size.
SD14 represents the value obtained by dividing standard deviation of 14th student divided by sample size.
So, SD3 is less than SD
So, SD7 is less than SD.
So, SD14 is less than SD.
Therefore, the standard deviations for 3rd, 7th and 14th student divided by sample sizes are less than the standard deviation of means.
Moreover, the standard deviation of means is greater than standard deviation divided by square root of the sample size.
Want to see more full solutions like this?
Chapter 6 Solutions
Elementary Statistics: A Step By Step Approach


- At the same restaurant as in Question 19 with the same normal distribution, what's the chance of it taking no more than 15 minutes to get service?arrow_forwardClint, obviously not in college, sleeps an average of 8 hours per night with a standard deviation of 15 minutes. What's the chance of him sleeping between 7.5 and 8.5 hours on any given night? 0-(7-0) 200 91109s and doiw $20 (8-0) mol 8520 slang $199 galbrog seam side pide & D (newid se od poyesvig as PELEO PER AFTE editiw noudab temand van Czarrow_forwardTimes to complete a statistics exam have a normal distribution with a mean of 40 minutes and standard deviation of 6 minutes. Deshawn's time comes in at the 90th percentile. What percentage of the students are still working on their exams when Deshawn leaves?arrow_forward
- Suppose that the weights of cereal boxes have a normal distribution with a mean of 20 ounces and standard deviation of half an ounce. A box that has a standard score of o weighs how much? syed by ilog ni 21arrow_forwardBob scores 80 on both his math exam (which has a mean of 70 and standard deviation of 10) and his English exam (which has a mean of 85 and standard deviation of 5). Find and interpret Bob's Z-scores on both exams to let him know which exam (if either) he did bet- ter on. Don't, however, let his parents know; let them think he's just as good at both subjects. algas 70) sering digarrow_forwardSue's math class exam has a mean of 70 with a standard deviation of 5. Her standard score is-2. What's her original exam score?arrow_forward
- Clint sleeps an average of 8 hours per night with a standard deviation of 15 minutes. What's the chance he will sleep less than 7.5 hours tonight? nut bow visarrow_forwardSuppose that your score on an exam is directly at the mean. What's your standard score?arrow_forwardOne state's annual rainfall has a normal dis- tribution with a mean of 100 inches and standard deviation of 25 inches. Suppose that corn grows best when the annual rainfall is between 100 and 150 inches. What's the chance of achieving this amount of rainfall? wved now of sociarrow_forward
- 13 Suppose that your exam score has a standard score of 0.90. Does this mean that 90 percent of the other exam scores are lower than yours?arrow_forwardBob's commuting times to work have a nor- mal distribution with a mean of 45 minutes and standard deviation of 10 minutes. How often does Bob get to work in 30 to 45 minutes?arrow_forwardBob's commuting times to work have a nor- mal distribution with a mean of 45 minutes and standard deviation of 10 minutes. a. What percentage of the time does Bob get to work in 30 minutes or less? b. Bob's workday starts at 9 a.m. If he leaves at 8 a.m., how often is he late?arrow_forward
 Holt Mcdougal Larson Pre-algebra: Student Edition...AlgebraISBN:9780547587776Author:HOLT MCDOUGALPublisher:HOLT MCDOUGAL
 Glencoe Algebra 1, Student Edition, 9780079039897...AlgebraISBN:9780079039897Author:CarterPublisher:McGraw Hill
 College Algebra (MindTap Course List)AlgebraISBN:9781305652231Author:R. David Gustafson, Jeff HughesPublisher:Cengage Learning
 Algebra and Trigonometry (MindTap Course List)AlgebraISBN:9781305071742Author:James Stewart, Lothar Redlin, Saleem WatsonPublisher:Cengage Learning