
Introductory Statistics (10th Edition)
10th Edition
ISBN: 9780321989178
Author: Neil A. Weiss
Publisher: PEARSON
expand_more
expand_more
format_list_bulleted
Concept explainers
Videos
Textbook Question
Chapter 6.2, Problem 68E
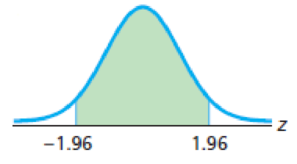
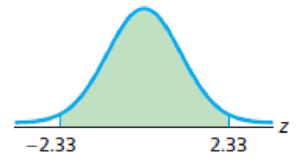
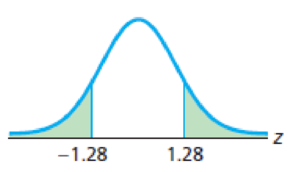
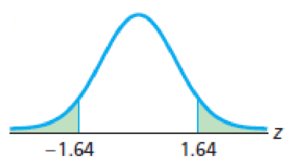
Use Table II to obtain each shaded area under the standard normal curve.
Expert Solution & Answer
Want to see the full answer?
Check out a sample textbook solution
Students have asked these similar questions
Example 4 (Part 2) We can use Statkey to take 50 different random samples of size 20 each, find the mean of
each sample, and compute a confidence interval for each one. The graph of the sampling distribution of the means
is on the left below, and that of the 50 confidence intervals is on the right.
1. What does each dot on the left hand dotplot represent?
StatKey Sampling Distribution for a Mean
Percent with Internet Access (Countries) ▾
Show Data Table Edit Data
Choose samples of size n =
20
Upload File
Change Column(s)
Generate 1 Sample
Generate 10 Samples
Generate 100 Samples
Generate 1000 Samples
Reset Plot
Sampling Dotplot of Mean
Left Tail Two-Tail Right Tail
60
50
40
40
30
20
20
10
samples = 50
mean = 41.626
std. error = 5.089
:
.:
:
::
0
25
30
35
40
45
50
55
60
41.626
Data Plots
Confidence Intervals
95%->
Confidence Intervals
Coverage
48/50 = 96%
20
40
60
80
2. Circle the confidence intervals that failed to capture the true mean.
3. Circle the sample means that produced those…
Example 4 (Part 1) One of the datasets in the Lock book
contains information about 215 countries of the world. One
of the variables is the percentage of people in the country
who have access to the internet. We have data for 203 of
those countries. The plot on the right shows a dotplot of
the data.
1. What are the cases?
Population
n = 203, mean = 43.024
median = 43.5, stdev = 29.259
20
2. What does each dot on the dotplot represent?
15
10
5
20
40
43.024
60
80
3. What type of data is do we collect from the cases, quantitative or categorical?
Let x be a random variable that represents the percentage of successful free throws a professional basketball player makes in a season. Let y be a random variable that represents the percentage of successful field goals a professional basketball player makes in a season. A random sample of n =6 professional basketball players gave the following information.
x
63
79
70
80
84
87
y
46
49
45
55
57
58
Find Se. Round your answer to three decimal places.
Chapter 6 Solutions
Introductory Statistics (10th Edition)
Ch. 6.1 - What is a density curve?Ch. 6.1 - State the two basic properties of every density...Ch. 6.1 - For a variable with a density curve, what is the...Ch. 6.1 - In each of Exercises 6.46.11, assume that the...Ch. 6.1 - In each of Exercises 6.46.11, assume that the...Ch. 6.1 - In each of Exercises 6.46.11, assume that the...Ch. 6.1 - In each of Exercises 6.46.11, assume that the...Ch. 6.1 - In each of Exercises 6.46.11, assume that the...Ch. 6.1 - In each of Exercises 6.46.11, assume that the...Ch. 6.1 - In each of Exercises 6.46.11, assume that the...
Ch. 6.1 - In each of Exercises 6.46.11, assume that the...Ch. 6.1 - A curve has area 0.425 to the left of 4 and area...Ch. 6.1 - A curve has area 0.613 to the left of 65 and area...Ch. 6.1 - Prob. 14ECh. 6.1 - A variable is approximately normally distributed....Ch. 6.1 - Precisely what is meant by the statement that a...Ch. 6.1 - Two normally distributed variables have the same...Ch. 6.1 - Which normal distribution has a wider spread: the...Ch. 6.1 - Consider two normal distributions, one with mean 4...Ch. 6.1 - Prob. 20ECh. 6.1 - True or false: The mean of a normal distribution...Ch. 6.1 - Prob. 22ECh. 6.1 - Sketch the normal distribution with a. = 3 and =...Ch. 6.1 - Prob. 24ECh. 6.1 - For a normally distributed variable, what is the...Ch. 6.1 - Prob. 26ECh. 6.1 - Prob. 27ECh. 6.1 - The area under a particular normal curve between...Ch. 6.1 - A variable has the density curve whose equation is...Ch. 6.1 - A variable has the density curve whose equation is...Ch. 6.1 - Waiting for the Train. A commuter train arrives...Ch. 6.1 - Bacteria on a Petri Dish. A petri dish is a small,...Ch. 6.1 - Fire Loss. The loss, in millions of dollars, due...Ch. 6.1 - Emergency Room Traffic. Desert Samaritan Hospital...Ch. 6.1 - Female College Students. Refer to Example 6.3 on...Ch. 6.1 - Female College Students. Refer to Example 6.3 on...Ch. 6.1 - Giant Tarantulas. One of the larger species of...Ch. 6.1 - Serum Cholesterol Levels. According to the...Ch. 6.1 - New York City 10-km Run. As reported in Runners...Ch. 6.1 - Prob. 40ECh. 6.1 - Ages of Mothers. From the document National Vital...Ch. 6.1 - Prob. 42ECh. 6.1 - Cloudiness in Breslau. In the paper Cloudiness:...Ch. 6.1 - Prob. 44ECh. 6.1 - Prob. 45ECh. 6.1 - Prob. 46ECh. 6.1 - Chips Ahoy! 1,000 Chips Challenge. Students in an...Ch. 6.1 - Gestation Periods of Humans. Refer to the...Ch. 6.1 - Delaying Adulthood. In the paper, Delayed...Ch. 6.2 - With which normal distribution is the standard...Ch. 6.2 - Without consulting Table II, explain why the area...Ch. 6.2 - Prob. 52ECh. 6.2 - Prob. 53ECh. 6.2 - Prob. 54ECh. 6.2 - Prob. 55ECh. 6.2 - Prob. 56ECh. 6.2 - Prob. 57ECh. 6.2 - Prob. 58ECh. 6.2 - Use Table II to obtain the areas under the...Ch. 6.2 - Use Table II to obtain the areas under the...Ch. 6.2 - Use Table II to obtain the areas under the...Ch. 6.2 - Use Table II to obtain the areas under the...Ch. 6.2 - Use Table II to obtain the areas under the...Ch. 6.2 - Use Table II to obtain the areas under the...Ch. 6.2 - Use Table II to obtain the areas under the...Ch. 6.2 - Use Table II to obtain the areas under the...Ch. 6.2 - Use Table II to obtain each shaded area under the...Ch. 6.2 - Use Table II to obtain each shaded area under the...Ch. 6.2 - In each part, find the area under the standard...Ch. 6.2 - The total area under the following standard normal...Ch. 6.2 - In Exercises 6.716.82, use Table II to obtain the...Ch. 6.2 - In Exercises 6.716.82, use Table II to obtain the...Ch. 6.2 - In Exercises 6.716.82, use Table II to obtain the...Ch. 6.2 - Prob. 74ECh. 6.2 - In Exercises 6.716.82, use Table II to obtain the...Ch. 6.2 - In Exercises 6.716.82, use Table II to obtain the...Ch. 6.2 - Prob. 77ECh. 6.2 - In Exercises 6.716.82, use Table II to obtain the...Ch. 6.2 - Prob. 79ECh. 6.2 - Prob. 80ECh. 6.2 - In Exercises 6.716.82, use Table II to obtain the...Ch. 6.2 - In Exercises 6.716.82, use Table II to obtain the...Ch. 6.2 - Complete the following table.Ch. 6.2 - Prob. 84ECh. 6.2 - Prob. 85ECh. 6.3 - Briefly, for a normally distributed variable, how...Ch. 6.3 - Explain why the percentage of all possible...Ch. 6.3 - Prob. 88ECh. 6.3 - Prob. 89ECh. 6.3 - A variable is normally distributed with mean 68...Ch. 6.3 - A variable is normally distributed with mean 10...Ch. 6.3 - Prob. 92ECh. 6.3 - A variable is normally distributed with mean 6 and...Ch. 6.3 - A variable is normally distributed with mean 68...Ch. 6.3 - A variable is normally distributed with mean 10...Ch. 6.3 - A variable is normally distributed with mean 0 and...Ch. 6.3 - Giant Tarantulas. One of the larger species of...Ch. 6.3 - Serum Cholesterol Levels. According to the...Ch. 6.3 - New York City 10-km Run. As reported in Runners...Ch. 6.3 - Green Sea Urchins. From the paper Effects of...Ch. 6.3 - Arterial Cord pH. Umbilical cord blood analysis...Ch. 6.3 - Elephant Pregnancies. G. Wittemeyer et al. studied...Ch. 6.3 - Gibbon Song Duration. A preliminary behavioral...Ch. 6.3 - Friendship Motivation. In the article Assessing...Ch. 6.3 - Brain Weights. In 1905, R. Pearl published the...Ch. 6.3 - Children Watching TV. The A. C. Nielsen Company...Ch. 6.3 - Heights of Female Students. Refer to Example 6.3...Ch. 6.3 - Womens Shoes. Research reveals that foot length of...Ch. 6.3 - College-Math Success. Researchers S. Lesik and M....Ch. 6.3 - Tipping. In the article Are Christian/Religious...Ch. 6.3 - Booted Eagles. The rare booted eagle of western...Ch. 6.3 - Emergency Room Traffic. Desert Samaritan Hospital...Ch. 6.3 - Let 0 1. For a normally distributed variable,...Ch. 6.3 - Express the quartiles, Q1, Q2, and Q3, of a...Ch. 6.3 - Express the kth percentile, Pk , of a normally...Ch. 6.4 - Under what circumstances is using a normal...Ch. 6.4 - Explain why assessing the normality of a variable...Ch. 6.4 - Explain in detail what a normal probability plot...Ch. 6.4 - How is a normal probability plot used to detect...Ch. 6.4 - Explain how to obtain normal scores from Table III...Ch. 6.4 - In each of Exercises 6.1216.126, we have provided...Ch. 6.4 - In each of Exercises 6.1216.126, we have provided...Ch. 6.4 - In each of Exercises 6.1216.126, we have provided...Ch. 6.4 - In each of Exercises 6.1216.126, we have provided...Ch. 6.4 - In each of Exercises 6.1216.126, we have provided...Ch. 6.4 - Prob. 126ECh. 6.4 - In Exercises 6.1276.130, a. use Table III in...Ch. 6.4 - Prob. 128ECh. 6.4 - In Exercises 6.1276.130, a. use Table III in...Ch. 6.4 - In Exercises 6.1276.130, a. use Table III in...Ch. 6.4 - Prob. 131ECh. 6.4 - In Exercises 6.1316.134, a. obtain a normal...Ch. 6.4 - Prob. 133ECh. 6.4 - Prob. 134ECh. 6.4 - Body Temperature. A study by researchers at the...Ch. 6.4 - Vegetarians and Omnivores. Philosophical and...Ch. 6.4 - Prob. 137ECh. 6.4 - Finger Length of Criminals. In 1902, W. R....Ch. 6.4 - Prob. 139ECh. 6.4 - Emergency Room Traffic. Desert Samaritan Hospital...Ch. 6.5 - Why should you sometimes use normal-curve areas to...Ch. 6.5 - The rule of thumb for using the normal...Ch. 6.5 - In Exercises 6.1436.160, X denotes a binomial...Ch. 6.5 - In Exercises 6.1436.160, X denotes a binomial...Ch. 6.5 - In Exercises 6.1436.160, X denotes a binomial...Ch. 6.5 - In Exercises 6.1436.160, X denotes a binomial...Ch. 6.5 - In Exercises 6.1436.160, X denotes a binomial...Ch. 6.5 - In Exercises 6.1436.160, X denotes a binomial...Ch. 6.5 - In Exercises 6.1436.160, X denotes a binomial...Ch. 6.5 - In Exercises 6.1436.160, X denotes a binomial...Ch. 6.5 - In Exercises 6.1436.160, X denotes a binomial...Ch. 6.5 - In Exercises 6.1436.160, X denotes a binomial...Ch. 6.5 - In Exercises 6.1436.160, X denotes a binomial...Ch. 6.5 - In Exercises 6.1436.160, X denotes a binomial...Ch. 6.5 - In Exercises 6.1436.160, X denotes a binomial...Ch. 6.5 - In Exercises 6.1436.160, X denotes a binomial...Ch. 6.5 - Prob. 157ECh. 6.5 - Prob. 158ECh. 6.5 - In Exercises 6.1436.160, X denotes a binomial...Ch. 6.5 - In Exercises 6.1436.160, X denotes a binomial...Ch. 6.5 - TrueFalse Exams. Refer to Example 6.20 on page...Ch. 6.5 - Prob. 162ECh. 6.5 - TrueFalse Exams. If, in Example 6.20, the...Ch. 6.5 - TrueFalse Exams. If, in Example 6.20, the...Ch. 6.5 - Applying the Concepts and Skills In Exercises...Ch. 6.5 - In Exercises 6.1656.172, apply Procedure 6.3 on...Ch. 6.5 - In Exercises 6.1656.172, apply Procedure 6.3 on...Ch. 6.5 - In Exercises 6.1656.172, apply Procedure 6.3 on...Ch. 6.5 - In Exercises 6.1656.172, apply Procedure 6.3 on...Ch. 6.5 - In Exercises 6.1656.172, apply Procedure 6.3 on...Ch. 6.5 - In Exercises 6.1656.172, apply Procedure 6.3 on...Ch. 6.5 - Prob. 172ECh. 6.5 - Roulette. An American roulette wheel consists of...Ch. 6.5 - Flashlight Battery Lifetimes. A brand of...Ch. 6.5 - Prob. 175ECh. 6 - What is a density curve, and why are such curves...Ch. 6 - In each of Problems 24, assume that the variable...Ch. 6 - In each of Problems 24, assume that the variable...Ch. 6 - In each of Problems 24, assume that the variable...Ch. 6 - Prob. 5RPCh. 6 - State two of the main reasons for studying the...Ch. 6 - Prob. 7RPCh. 6 - Answer true or false to each statement. Give...Ch. 6 - Explain the relationship between percentages for a...Ch. 6 - Prob. 10RPCh. 6 - Prob. 11RPCh. 6 - Prob. 12RPCh. 6 - What key fact permits you to determine percentages...Ch. 6 - Prob. 14RPCh. 6 - Prob. 15RPCh. 6 - Prob. 16RPCh. 6 - State the empirical rule for variables.Ch. 6 - Prob. 18RPCh. 6 - Prob. 19RPCh. 6 - Prob. 20RPCh. 6 - Prob. 21RPCh. 6 - Prob. 22RPCh. 6 - For the standard normal curve, find the z-score(s)...Ch. 6 - Dispensing Coffee. A coffee machine is supposed to...Ch. 6 - Forearm Length. In 1903, K. Pearson and A. Lee...Ch. 6 - Birth Weights. The WONDER database, maintained by...Ch. 6 - Lower Limb Surgery. The study Intrathecal...Ch. 6 - Verbal GRE Scores. The Graduate Record Examination...Ch. 6 - Verbal GRE Scores. Refer to Problem 28, and fill...Ch. 6 - Prob. 30RPCh. 6 - Prob. 31RPCh. 6 - Diarrhea Vaccine. Acute rotavirus diarrhea is the...Ch. 6 - FOCUSING ON DATA ANALYSIS UWEC UNDERGRADUATES...Ch. 6 - CASE STUDY DISCUSSION CHEST SIZES OF SCOTTISH...
Additional Math Textbook Solutions
Find more solutions based on key concepts
1. How much money is Joe earning when he’s 30?
Pathways To Math Literacy (looseleaf)
CHECK POINT I Consider the six jokes about books by Groucho Marx. Bob Blitzer. Steven Wright, HennyYoungman. Je...
Thinking Mathematically (6th Edition)
Provide an example of a qualitative variable and an example of a quantitative variable.
Elementary Statistics ( 3rd International Edition ) Isbn:9781260092561
NOTE: Write your answers using interval notation when appropriate.
CHECKING ANALYTIC SKILLS Fill in each blank ...
Graphical Approach To College Algebra
153. A rain gutter is made from sheets of aluminum that are 20 inches wide. As shown in the figure, the edges ...
College Algebra (7th Edition)
(a) Make a stem-and-leaf plot for these 24 observations on the number of customers who used a down-town CitiBan...
APPLIED STAT.IN BUS.+ECONOMICS
Knowledge Booster


Learn more about
Need a deep-dive on the concept behind this application? Look no further. Learn more about this topic, statistics and related others by exploring similar questions and additional content below.Similar questions
- 1. Define probability: 2. Define statistics:arrow_forwardResults of tossing a coin four times: H, H, H, H How many times is the Coin expected to come up heads? How did you determine this number? Calculate the % deviation. Can these results be used to conclude that a coin is not fair? Why or why not?arrow_forwardCycles to failure Position in ascending order 0.5 f(x)) (x;) Problem 44 Marsha, a renowned cake scientist, is trying to determine how long different cakes can survive intense fork attacks before collapsing into crumbs. To simulate real-world cake consumption, she designs a test where cakes are subjected to repeated fork stabs and bites, mimicking the brutal reality of birthday parties. After rigorous testing, Marsha records 10 observations of how many stabs each cake endured before structural failure. Construct P-P plots for (a.) a normal distribution, (b.) a lognormal distribution, and (c.) a Weibull distribution (using the information included in the table below). Which distribution seems to be the best model for the cycles to failure for this material? Explain your answer in detail. Observation Empirical cumulative Probability distribution Cumulative distribution Inverse of cumulative distribution F-1 (-0.5) F(x)) (S) n 4 3 1 0.05 9 5 2 0.15 7 7 3 0.25 1 10 4 0.35 3 12 5 0.45 Normal…arrow_forward
- Problem 3 In their lab, engineer Daniel and Paulina are desperately trying to perfect time travel. But the problem is that their machine still struggles with power inconsistencies-sometimes generating too little energy, other times too much, causing unstable time jumps. To prevent catastrophic misjumps into the Jurassic era or the far future, they must calibrate the machine's power output. After extensive testing, they found that the time machine's power output follows a normal distribution, with an average energy level of 8.7 gigawatts and a standard deviation of 1.2 gigawatts. The Time Travel Safety Board has set strict guidelines: For a successful time jump, the machine's power must be between 8.5 and 9.5 gigawatts. What is the probability that a randomly selected time jump meets this precision requirement? Daniel suggests that adjusting the mean power output could improve time-travel accuracy. Can adjusting the mean reduce the number of dangerous misjumps? If yes, what should the…arrow_forwardProblem 5 ( Marybeth is also interested in the experiment from Problem 2 (associated with the enhancements for Captain America's shield), so she decides to start a detailed literature review on the subject. Among others, she found a paper where they used a 2"(4-1) fractional factorial design in the factors: (A) shield material, (B) throwing mechanism, (C) edge modification, and (D) handle adjustment. The experimental design used in the paper is shown in the table below. a. Run A B с D 1 (1) -1 -1 -1 1 2 a 1 -1 -1 1 3 bd -1 1 -1 1 4 abd 1 1 -1 1 5 cd -1 -1 1 -1 6 acd 1 -1 1 -1 7 bc -1 1 1 -1 abc 1 1 1 -1 paper? s) What was the generator used in the 2"(4-1) fractional factorial design described in the b. Based on the resolution of this design, what do you think about the generator used in the paper? Do you think it was a good choice, or would you have selected a different one? Explain your answer in detail.arrow_forwardSuppose we wish to test the hypothesis that women with a sister’s history of breast cancer are at higher risk of developing breast cancer themselves. Suppose we assume that the prevalence rate of breast cancer is 3% among 60- to 64-year-old U.S. women, whereas it is 5% among women with a sister history. We propose to interview 400 women 40 to 64 years of age with a sister history of the disease. What is the power of such a study assuming that the level of significance is 10%? I only need help writing the null and alternative hypotheses.arrow_forward
- 4.96 The breaking strengths for 1-foot-square samples of a particular synthetic fabric are approximately normally distributed with a mean of 2,250 pounds per square inch (psi) and a standard deviation of 10.2 psi. Find the probability of selecting a 1-foot-square sample of material at random that on testing would have a breaking strength in excess of 2,265 psi.4.97 Refer to Exercise 4.96. Suppose that a new synthetic fabric has been developed that may have a different mean breaking strength. A random sample of 15 1-foot sections is obtained, and each section is tested for breaking strength. If we assume that the population standard deviation for the new fabric is identical to that for the old fabric, describe the sampling distribution forybased on random samples of 15 1-foot sections of new fabricarrow_forwardUne Entreprise œuvrant dans le domaine du multividéo donne l'opportunité à ses programmeurs-analystes d'évaluer la performance des cadres supérieurs. Voici les résultats obtenues (sur une échelle de 10 à 50) où 50 représentent une excellente performance. 10 programmeurs furent sélectionnés au hazard pour évaluer deux cadres. Un rapport Excel est également fourni. Programmeurs Cadre A Cadre B 1 34 36 2 32 34 3 18 19 33 38 19 21 21 23 7 35 34 8 20 20 9 34 34 10 36 34 Test d'égalité des espérances: observations pairéesarrow_forwardA television news channel samples 25 gas stations from its local area and uses the results to estimate the average gas price for the state. What’s wrong with its margin of error?arrow_forward
- You’re fed up with keeping Fido locked inside, so you conduct a mail survey to find out people’s opinions on the new dog barking ordinance in a certain city. Of the 10,000 people who receive surveys, 1,000 respond, and only 80 are in favor of it. You calculate the margin of error to be 1.2 percent. Explain why this reported margin of error is misleading.arrow_forwardYou find out that the dietary scale you use each day is off by a factor of 2 ounces (over — at least that’s what you say!). The margin of error for your scale was plus or minus 0.5 ounces before you found this out. What’s the margin of error now?arrow_forwardSuppose that Sue and Bill each make a confidence interval out of the same data set, but Sue wants a confidence level of 80 percent compared to Bill’s 90 percent. How do their margins of error compare?arrow_forward
arrow_back_ios
SEE MORE QUESTIONS
arrow_forward_ios
Recommended textbooks for you
 Big Ideas Math A Bridge To Success Algebra 1: Stu...AlgebraISBN:9781680331141Author:HOUGHTON MIFFLIN HARCOURTPublisher:Houghton Mifflin Harcourt
 Glencoe Algebra 1, Student Edition, 9780079039897...AlgebraISBN:9780079039897Author:CarterPublisher:McGraw Hill
 College Algebra (MindTap Course List)AlgebraISBN:9781305652231Author:R. David Gustafson, Jeff HughesPublisher:Cengage Learning
 Holt Mcdougal Larson Pre-algebra: Student Edition...AlgebraISBN:9780547587776Author:HOLT MCDOUGALPublisher:HOLT MCDOUGAL
 Trigonometry (MindTap Course List)TrigonometryISBN:9781337278461Author:Ron LarsonPublisher:Cengage Learning
Big Ideas Math A Bridge To Success Algebra 1: Stu...
Algebra
ISBN:9781680331141
Author:HOUGHTON MIFFLIN HARCOURT
Publisher:Houghton Mifflin Harcourt
Glencoe Algebra 1, Student Edition, 9780079039897...
Algebra
ISBN:9780079039897
Author:Carter
Publisher:McGraw Hill
College Algebra (MindTap Course List)
Algebra
ISBN:9781305652231
Author:R. David Gustafson, Jeff Hughes
Publisher:Cengage Learning
Holt Mcdougal Larson Pre-algebra: Student Edition...
Algebra
ISBN:9780547587776
Author:HOLT MCDOUGAL
Publisher:HOLT MCDOUGAL
Trigonometry (MindTap Course List)
Trigonometry
ISBN:9781337278461
Author:Ron Larson
Publisher:Cengage Learning
Area Between The Curve Problem No 1 - Applications Of Definite Integration - Diploma Maths II; Author: Ekeeda;https://www.youtube.com/watch?v=q3ZU0GnGaxA;License: Standard YouTube License, CC-BY