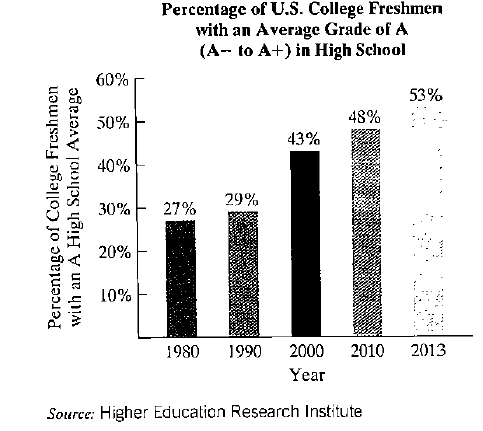
Grade Inflation. The bar graph shows the percentage of UScollege freshmen with an average grade of A in high school.

The data displayed by the bar graph can be described by the mathematical model
where x is the number of years after 1980 and p is the percentage of U.S. college freshmen who had an average grade of A in highschool. Use this information to solve Exercises 107-108.
107. a. According to the formula, in 2010, what percentage of U.S. college freshmen had an average grade of A in high school? Does this underestimate or overestimate the percent displayed by the bar graph? By how much? 49. % overestimates by 1%
b. If trends shown by the formula continue, project when57% of US. college freshmen will have and an averagegrade of A in high school 2020
Want to see the full answer?
Check out a sample textbook solution
Chapter 6 Solutions
THINK.MATH.EBOOK W/18 WEEK MYLAB ACCESS
Additional Math Textbook Solutions
Pathways To Math Literacy (looseleaf)
College Algebra (Collegiate Math)
Elementary and Intermediate Algebra: Concepts and Applications (7th Edition)
APPLIED STAT.IN BUS.+ECONOMICS
University Calculus: Early Transcendentals (4th Edition)
Finite Mathematics for Business, Economics, Life Sciences and Social Sciences
- ball is drawn from one of three urns depending on the outcomeof a roll of a dice. If the dice shows a 1, a ball is drawn from Urn I, whichcontains 2 black balls and 3 white balls. If the dice shows a 2 or 3, a ballis drawn from Urn II, which contains 1 black ball and 3 white balls. Ifthe dice shows a 4, 5, or 6, a ball is drawn from Urn III, which contains1 black ball and 2 white balls. (i) What is the probability to draw a black ball? [7 Marks]Hint. Use the partition rule.(ii) Assume that a black ball is drawn. What is the probabilitythat it came from Urn I? [4 Marks]Total marks 11 Hint. Use Bayes’ rulearrow_forwardLet X be a random variable taking values in (0,∞) with proba-bility density functionfX(u) = 5e^−5u, u > 0.Let Y = X2 Total marks 8 . Find the probability density function of Y .arrow_forwardLet P be the standard normal distribution, i.e., P is the proba-bility measure on R, B(R) given bydP(x) = 1√2πe− x2/2dx.Consider the random variablesfn(x) = (1 + x2) 1/ne^(x^2/n+2) x ∈ R, n ∈ N.Using the dominated convergence theorem, prove that the limitlimn→∞E(fn)exists and find itarrow_forward
- OR 16 f(x) = Ef 16 χ по x²-2 410 | y = (x+2) + 4 Y-INT: y = 0 X-INT: X=0 VA: x=2 OA: y=x+2 0 X-INT: X=-2 X-INT: y = 2 VA 0 2 whole. 2-2 4 y - (x+2) = 27-270 + xxx> 2 क् above OA (x+2) OA x-2/x²+0x+0 2 x-2x 2x+O 2x-4 4 X<-1000 4/4/2<0 below Of y VA X=2 X-2 OA y=x+2 -2 2 (0,0) 2 χarrow_forwardpls help asaparrow_forwardI need help solving the equation 3x+5=8arrow_forward
- pls help asaparrow_forwardpls help asaparrow_forwardQuestion 2 (3.5 points) A firm produces a certain good. The current unit price of the good is equal to €7. At this price level, the marginal demand is equal to -0.8 and the point elasticity of demand is equal to -0.28. a. Give a precise economic interpretation of the number -0.8. b. Find the exact value of the current revenue of the firm and estimate the change in revenue if the current unit price is reduced by 3%. Next, assume that the demand is given by an equation of the form q = a/(bp). c. Find the values of the parameters a and b. Answer to Question 2:arrow_forward
 Algebra: Structure And Method, Book 1AlgebraISBN:9780395977224Author:Richard G. Brown, Mary P. Dolciani, Robert H. Sorgenfrey, William L. ColePublisher:McDougal Littell
 Holt Mcdougal Larson Pre-algebra: Student Edition...AlgebraISBN:9780547587776Author:HOLT MCDOUGALPublisher:HOLT MCDOUGAL
 College Algebra (MindTap Course List)AlgebraISBN:9781305652231Author:R. David Gustafson, Jeff HughesPublisher:Cengage Learning
- Algebra & Trigonometry with Analytic GeometryAlgebraISBN:9781133382119Author:SwokowskiPublisher:Cengage

 Big Ideas Math A Bridge To Success Algebra 1: Stu...AlgebraISBN:9781680331141Author:HOUGHTON MIFFLIN HARCOURTPublisher:Houghton Mifflin Harcourt


