Concept explainers
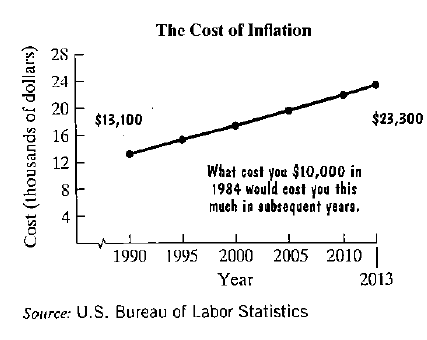
21. The line graph showy ‘he cost of inflation. What cost$10,000 in 1984 would cost the amount shown by thegraph in subsequent years.

Here are two mathematical models for tie data shown by the graph. In each formula. C represents the cost x yearsafter 1990 or what cost $10,000 in 1984.
Model 1
Model 2
a. Use the graph to estimate the cost in 2010, to the nearestthousand dollars, of what cost $10,000 in 1984 $22,000
b. Use model 1 to determine the cost in 2010 How welldoes this describe your estimate from part (a)? $21,809: reasonably well
c. Use model 2 to determine the cost in 2010. How welldoes this describe your estimate from pan (a)? $21,726: reasonably well
d. Use model 1 to determine in which year the cost will be$26,229 for what cost$10,000 in 1984 2020
Want to see the full answer?
Check out a sample textbook solution
Chapter 6 Solutions
THINK.MATH.EBOOK W/18 WEEK MYLAB ACCESS
- No chatgpt pls will upvotearrow_forwardTitle: Analyzing Customer Satisfaction for UnileverAs a member of Unilever's Customer Experience Management team, you are responsible forevaluating customer satisfaction levels and monitoring competitive moves. This case studyinvolves analyzing satisfaction data to test two key hypotheses about Unilever's performancerelative to its main competitor, Procter & Gamble (P&G).Unilever’s leadership team has emphasized the importance of customer satisfaction inmaintaining competitive advantage and market leadership. As part of this initiative, yourteam regularly monitors satisfaction scores and benchmarks them against competitors likeP&G.You are tasked with analyzing the provided dataset to answer the following questions:1. Does Unilever’s average customer satisfaction score meet the minimum threshold of2. 75%?Is there no significant difference between Unilever’s overall average satisfaction scoreand P&G’s average satisfaction score?arrow_forwardPlease help me first one graphically and the other in matrixarrow_forward
- Please help me with this in matrix pleasearrow_forwardPlease solve the differential geometry problem No chatgpt pls will upvote.arrow_forwardQ1. A group of five applicants for a pair of identical jobs consists of three men and two women. The employer is to select two of the five applicants for the jobs. Let S denote the set of all possible outcomes for the employer's selection. Let A denote the subset of outcomes corresponding to the selection of two men and B the subset corresponding to the selection of at least one woman. List the outcomes in A, B, AUB, AN B, and An B. (Denote the different men and women by M₁, M2, M3 and W₁, W2, respectively.)arrow_forward
- For the following function, find the full power series centered at a of convergence. 0 and then give the first 5 nonzero terms of the power series and the open interval = f(2) Σ 8 1(x)--(-1)*(3)* n=0 ₤(x) = + + + ++... The open interval of convergence is: 1 1 3 f(x)= = 28 3x6 +1 (Give your answer in help (intervals) .)arrow_forwardQ3 (8 points) Q3. A survey classified a large number of adults according to whether they were diag- nosed as needing eyeglasses to correct their reading vision and whether they use eyeglasses when reading. The proportions falling into the four resulting categories are given in the following table: Use Eyeglasses for Reading Needs glasses Yes No Yes 0.44 0.14 No 0.02 0.40 If a single adult is selected from the large group, find the probabilities of the events defined below. The adult (a) needs glasses. (b) needs glasses but does not use them. (c) uses glasses whether the glasses are needed or not.arrow_forward4. (i) Let a discrete sample space be given by N = {W1, W2, W3, W4}, and let a probability measure P on be given by P(w1) = 0.2, P(w2) = 0.2, P(w3) = 0.5, P(wa) = 0.1. Consider the random variables X1, X2 → R defined by X₁(w1) = 1, X₁(w2) = 2, X2(w1) = 2, X2 (w2) = 2, Find the joint distribution of X1, X2. (ii) X1(W3) = 1, X₁(w4) = 1, X2(W3) = 1, X2(w4) = 2. [4 Marks] Let Y, Z be random variables on a probability space (, F, P). Let the random vector (Y, Z) take on values in the set [0, 1] x [0,2] and let the joint distribution of Y, Z on [0, 1] x [0,2] be given by 1 dPy,z (y, z) ==(y²z+yz2) dy dz. harks 12 Find the distribution Py of the random variable Y. [8 Marks]arrow_forward
- Need help answering wuestionarrow_forwardFor the following function, find the full power series centered at x = 0 and then give the first 5 nonzero terms of the power series and the open interval of convergence. f(x) = Σ| n=0 9 f(x) = 6 + 4x f(x)− + + + ++··· The open interval of convergence is: ☐ (Give your answer in help (intervals) .)arrow_forwardmarks 11 3 3/4 x 1/4 1. There are 4 balls in an urn, of which 3 balls are white and 1 ball is black. You do the following: draw a ball from the urn at random, note its colour, do not return the ball to the urn; draw a second ball, note its colour, return the ball to the urn; finally draw a third ball and note its colour. (i) Describe the corresponding discrete probability space (Q, F, P). [9 Marks] (ii) Consider the following event, A: Among the first and the third balls, one ball is white, the other is black. Write down A as a subset of the sample space and find its probability, P(A). [2 Marks]arrow_forward
 Glencoe Algebra 1, Student Edition, 9780079039897...AlgebraISBN:9780079039897Author:CarterPublisher:McGraw Hill
 Elementary AlgebraAlgebraISBN:9780998625713Author:Lynn Marecek, MaryAnne Anthony-SmithPublisher:OpenStax - Rice University
 Trigonometry (MindTap Course List)TrigonometryISBN:9781337278461Author:Ron LarsonPublisher:Cengage Learning


