
Concept explainers
Videos
Fasteners are manufactured for an application involving aircraft. Each fastener is categorized either as conforming (suitable for its intended use), downgraded (unsuitable for its intended use but usable for another purpose), and scrap (not usable). It is thought that 85% of the fasteners are conforming, while 10% are downgraded and 5% are scrap. In a sample of 500 fasteners. 405 were conforming, 55 were downgraded, and 40 were scrap. Can you conclude that the true percentages differ from 85%, 10%, and 5%?
- a. State the appropriate null hypothesis.
- b. Compute the
expected values under the null hypothesis. - c. Compute the value of the chi-square statistic.
- d. Find the P-value. What do you conclude?
a.
State the appropriate null hypothesis.
Explanation of Solution
Given info:
In a sample of 500 fasteners, 405 were conforming, 55 were downgraded, and 40 were scrap. The proportions of fasteners in the three categories are 85%, 10% and 5%.
Justification:
Let
Here, the claim is that the true percentages differ from 85%, 10%, and 5%.
The null hypothesis is,
b.
Compute the expected values under the null hypothesis.
Answer to Problem 1E
The expected value is tabulated below:
| Category | |
| Conforming | |
| Downgraded | |
| scrap | |
Explanation of Solution
Calculation:
The formula for expected value is,
The expected value is calculated as follows:
| Category | Observed value | Proportion | |
| Conforming | 405 | 0.85 | |
| Downgraded | 55 | 0.10 | |
| scrap | 40 | 0.05 | |
| Total = 500 |
c.
Compute the value of the chi-square statistic.
Answer to Problem 1E
The chi square statistic is 10.4412.
Explanation of Solution
Calculation:
The formula for chi square statistic is,
The chi square statistic is calculated as follows:
| Category | Observed value | Expected value | |
| Conforming | 405 | 425 | |
| Downgraded | 55 | 50 | |
| scrap | 40 | 25 | |
| Total = 500 |
From the table, the chi square statistic is 10.4412.
d.
Find the P-value and state the conclusion.
Answer to Problem 1E
The P-value is 0.0054.
There is evidence to conclude that the true percentages differ from 85%, 10%, and 5%.
Explanation of Solution
Calculation:
Degrees of freedom:
P-value:
Software Procedure:
Step-by-step procedure to obtain the P-value using the MINITAB software:
- Choose Graph > Probability Distribution Plot choose View Probability > OK.
- From Distribution, choose ‘Chi square’ distribution.
- In Degrees of freedom, enter 2.
- Click the Shaded Area tab.
- Choose X Value and Right Tail for the region of the curve to shade.
- Enter the data value as 10.4412.
- Click OK.
Output using the MINITAB software is given below:
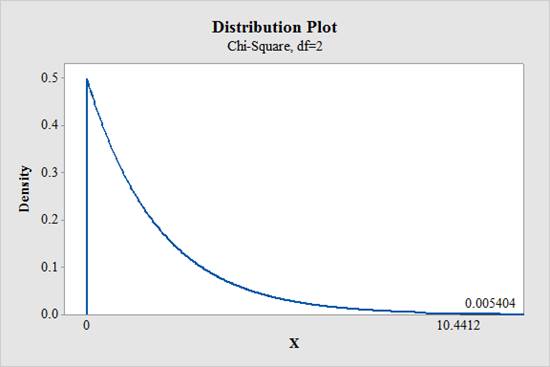
From the MINITAB output, the P-value is 0.0054.
Conclusion:
The P-value is 0.0054 and the significance level is 0.05.
Here, the P-value is less than the significance level.
That is,
Therefore, the null hypothesis is rejected.
Thus, there is evidence to conclude that the true percentages differ from 85%, 10%, and 5%.
Want to see more full solutions like this?
Chapter 6 Solutions
Statistics for Engineers and Scientists
Additional Math Textbook Solutions
University Calculus: Early Transcendentals (4th Edition)
Elementary & Intermediate Algebra
Precalculus: A Unit Circle Approach (3rd Edition)
A First Course in Probability (10th Edition)
Elementary Statistics: Picturing the World (7th Edition)
Basic College Mathematics


- Question 2 A nickel-titanium alloy is used to make components for jet turbine aircraft engines. Cracking is a potentially serious problem in the final part because it can lead to nonrecoverable failure. A test is run at the parts producer to determine the effect of four factors on cracks. The four factors are: pouring temperature (A), titanium content (B), heat treatment method (C), amount of grain refiner used (D). Two replicates of a 24 design are run, and the length of crack (in mm x10-2) induced in a sample coupon subjected to a standard test is measured. The data are shown in Table 2. 1 (a) Estimate the factor effects. Which factor effects appear to be large? (b) Conduct an analysis of variance. Do any of the factors affect cracking? Use a = 0.05. (c) Write down a regression model that can be used to predict crack length as a function of the significant main effects and interactions you have identified in part (b). (d) Analyze the residuals from this experiment. (e) Is there an…arrow_forwardA 24-1 design has been used to investigate the effect of four factors on the resistivity of a silicon wafer. The data from this experiment are shown in Table 4. Table 4: Resistivity Experiment for Exercise 5 Run A B с D Resistivity 1 23 2 3 4 5 6 7 8 9 10 11 12 I+I+I+I+Oooo 0 0 ||++TI++o000 33.2 4.6 31.2 9.6 40.6 162.4 39.4 158.6 63.4 62.6 58.7 0 0 60.9 3 (a) Estimate the factor effects. Plot the effect estimates on a normal probability scale. (b) Identify a tentative model for this process. Fit the model and test for curvature. (c) Plot the residuals from the model in part (b) versus the predicted resistivity. Is there any indication on this plot of model inadequacy? (d) Construct a normal probability plot of the residuals. Is there any reason to doubt the validity of the normality assumption?arrow_forwardStem1: 1,4 Stem 2: 2,4,8 Stem3: 2,4 Stem4: 0,1,6,8 Stem5: 0,1,2,3,9 Stem 6: 2,2 What’s the Min,Q1, Med,Q3,Max?arrow_forward
- Are the t-statistics here greater than 1.96? What do you conclude? colgPA= 1.39+0.412 hsGPA (.33) (0.094) Find the P valuearrow_forwardA poll before the elections showed that in a given sample 79% of people vote for candidate C. How many people should be interviewed so that the pollsters can be 99% sure that from 75% to 83% of the population will vote for candidate C? Round your answer to the whole number.arrow_forwardSuppose a random sample of 459 married couples found that 307 had two or more personality preferences in common. In another random sample of 471 married couples, it was found that only 31 had no preferences in common. Let p1 be the population proportion of all married couples who have two or more personality preferences in common. Let p2 be the population proportion of all married couples who have no personality preferences in common. Find a95% confidence interval for . Round your answer to three decimal places.arrow_forward
- A history teacher interviewed a random sample of 80 students about their preferences in learning activities outside of school and whether they are considering watching a historical movie at the cinema. 69 answered that they would like to go to the cinema. Let p represent the proportion of students who want to watch a historical movie. Determine the maximal margin of error. Use α = 0.05. Round your answer to three decimal places. arrow_forwardA random sample of medical files is used to estimate the proportion p of all people who have blood type B. If you have no preliminary estimate for p, how many medical files should you include in a random sample in order to be 99% sure that the point estimate will be within a distance of 0.07 from p? Round your answer to the next higher whole number.arrow_forwardA clinical study is designed to assess the average length of hospital stay of patients who underwent surgery. A preliminary study of a random sample of 70 surgery patients’ records showed that the standard deviation of the lengths of stay of all surgery patients is 7.5 days. How large should a sample to estimate the desired mean to within 1 day at 95% confidence? Round your answer to the whole number.arrow_forward
- A clinical study is designed to assess the average length of hospital stay of patients who underwent surgery. A preliminary study of a random sample of 70 surgery patients’ records showed that the standard deviation of the lengths of stay of all surgery patients is 7.5 days. How large should a sample to estimate the desired mean to within 1 day at 95% confidence? Round your answer to the whole number.arrow_forwardIn the experiment a sample of subjects is drawn of people who have an elbow surgery. Each of the people included in the sample was interviewed about their health status and measurements were taken before and after surgery. Are the measurements before and after the operation independent or dependent samples?arrow_forwardiid 1. The CLT provides an approximate sampling distribution for the arithmetic average Ỹ of a random sample Y₁, . . ., Yn f(y). The parameters of the approximate sampling distribution depend on the mean and variance of the underlying random variables (i.e., the population mean and variance). The approximation can be written to emphasize this, using the expec- tation and variance of one of the random variables in the sample instead of the parameters μ, 02: YNEY, · (1 (EY,, varyi n For the following population distributions f, write the approximate distribution of the sample mean. (a) Exponential with rate ẞ: f(y) = ß exp{−ßy} 1 (b) Chi-square with degrees of freedom: f(y) = ( 4 ) 2 y = exp { — ½/ } г( (c) Poisson with rate λ: P(Y = y) = exp(-\} > y! y²arrow_forward
 Holt Mcdougal Larson Pre-algebra: Student Edition...AlgebraISBN:9780547587776Author:HOLT MCDOUGALPublisher:HOLT MCDOUGAL
 Glencoe Algebra 1, Student Edition, 9780079039897...AlgebraISBN:9780079039897Author:CarterPublisher:McGraw Hill
 College Algebra (MindTap Course List)AlgebraISBN:9781305652231Author:R. David Gustafson, Jeff HughesPublisher:Cengage Learning
 Big Ideas Math A Bridge To Success Algebra 1: Stu...AlgebraISBN:9781680331141Author:HOUGHTON MIFFLIN HARCOURTPublisher:Houghton Mifflin Harcourt