
Videos
A machine that grinds valves is set to produce valves whose lengths have
- a. Find the rejection region if the test is made at the 5% level.
- b. Find the rejection region if the test is made at the 10% level.
- c. If the sample mean length is 99.97 mm, will H0 be rejected at the 5% level?
- d. If the sample mean length is 100.01 mm, will H0 be rejected at the 10% level?
- e. A critical point is 100.015 mm. What is the level of the test?
a.
Find the rejection region, if the test is made at 5% level.
Answer to Problem 11SE
The null hypothesis will be rejected, if
Explanation of Solution
Given info:
The hypotheses are:
The standard deviation is 0.1 mm and the sample size is 100.
Calculation:
Under
The rejection region consists of lower and upper 2.5% of the null distribution because the alternative hypothesis is of the form is
The lower and upper boundary is calculated as follows:
Software Procedure:
Step-by-step procedure to obtain the 5th percentile using the MINITAB software:
- Choose Graph > Probability Distribution Plot choose View Probability > OK.
- From Distribution, choose ‘Normal’ distribution.
- Click the Shaded Area tab.
- Choose Probability Value and Both Tails for the region of the curve to shade.
- Enter the Probability value as 0.05.
- Click OK.
Output using the MINITAB software is given below:
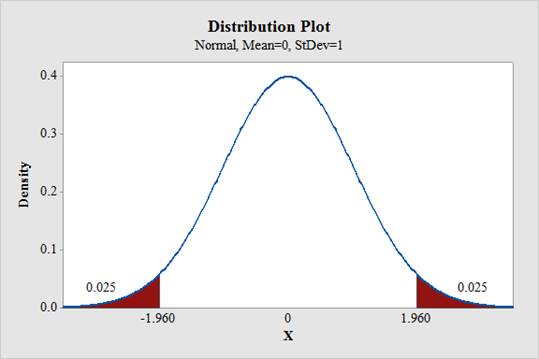
Therefore, the z-sore corresponding to the lower and upper 2.5% is –1.96 and +1.96, respectively.
The boundaries are calculated as follows:
Lower boundary:
Upper boundary:
Therefore, the rejection region is
If
b.
Find the rejection region, if the test is made at 10% level.
Answer to Problem 11SE
The null hypothesis will be rejected, if
Explanation of Solution
Calculation:
The rejection region consists of lower and upper 5% of the null distribution because the alternative hypothesis is of the form is
The lower and upper boundary is calculated as follows:
Software Procedure:
Step-by-step procedure to obtain the 10th percentile using the MINITAB software:
- Choose Graph > Probability Distribution Plot choose View Probability > OK.
- From Distribution, choose ‘Normal’ distribution.
- Click the Shaded Area tab.
- Choose Probability Value and Both Tails for the region of the curve to shade.
- Enter the Probability value as 0.10.
- Click OK.
Output using the MINITAB software is given below:
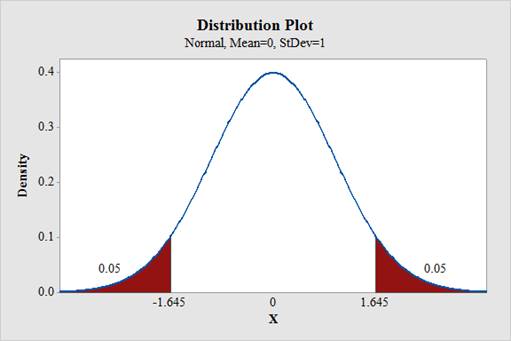
Therefore, the z-sore corresponding to the lower and upper 5% is –1.645 and +1.645, respectively.
The boundaries are calculated as follows:
Lower boundary:
Upper boundary:
Therefore, the rejection region is
If
c.
Check whether the null hypothesis will be rejected at the 5% level, if the sample mean length is 99.97 mm.
Answer to Problem 11SE
Yes, the null hypothesis will be rejected at 5% level.
Explanation of Solution
Calculation:
From part a., the null hypothesis will be rejected, if
Here, the sample mean is 99.97 mm.
Thus, the null hypothesis will be rejected at 5% level because
d.
Check whether the null hypothesis will be rejected at the 10% level, if the sample mean length is 100.01 mm.
Answer to Problem 11SE
No, the null hypothesis will not be rejected at 10% level.
Explanation of Solution
Calculation:
From part b., the null hypothesis will be rejected, if
Here, the sample mean is 100.01 mm.
Therefore, the null hypothesis will not be rejected at 10% level because
d.
Find the level of the test, if the critical point is 100.015 mm.
Answer to Problem 11SE
The level is 0.1336.
Explanation of Solution
Calculation:
Type-1 error: Rejecting the null hypothesis
The alternative hypothesis is of the form is
The given critical point is 100.015 mm and the other critical point is
The level of the test is,
The z-score of 99.985 is calculated below:
Software Procedure:
Step-by-step procedure to obtain the
- Choose Graph > Probability Distribution Plot choose View Probability > OK.
- From Distribution, choose ‘Normal’ distribution.
- Click the Shaded Area tab.
- Choose X Value and Left Tail for the region of the curve to shade.
- Enter the data value as -1.5.
- Click OK.
Output using the MINITAB software is given below:
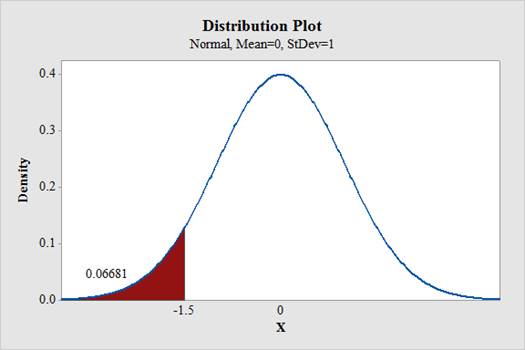
Thus,
The z-score of 100.015 is calculated below:
Software Procedure:
Step-by-step procedure to obtain the
- Choose Graph > Probability Distribution Plot choose View Probability > OK.
- From Distribution, choose ‘Normal’ distribution.
- Click the Shaded Area tab.
- Choose X Value and Right Tail for the region of the curve to shade.
- Enter the data value as 1.5.
- Click OK.
Output using the MINITAB software is given below:
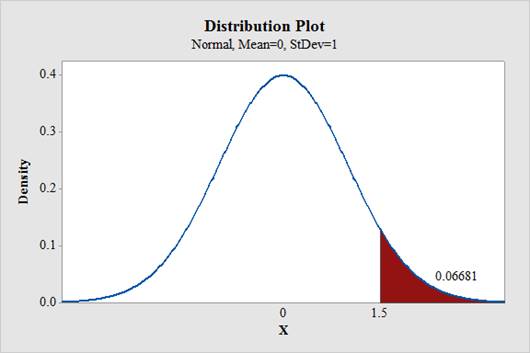
From the output,
Therefore, the level is given below:
Thus, the level is 0.1336.
Want to see more full solutions like this?
Chapter 6 Solutions
Statistics for Engineers and Scientists
Additional Math Textbook Solutions
Introductory Statistics
Math in Our World
Pathways To Math Literacy (looseleaf)
Basic College Mathematics
Elementary Statistics: Picturing the World (7th Edition)
APPLIED STAT.IN BUS.+ECONOMICS


- You want to make a salad from whatever vegetable you have in the fridge. You have seven different tomatoes. There are 2 red tomatoes, 4 yellow tomatoes, and one black tomato in the fridge. You have three different bell peppers. There is 1 red pepper, 1 yellow pepper, and 1 green pepper. What is the probability of randomly choosing a vegetable and getting a red tomato, and a green pepper? Round your answer to four decimal places.arrow_forwarduppose automobile insurance companies gave annual premiums for top-rated companies in several states. The figure below shows box plots for the annual premium for urban customers in three states. Which state offers the lowest premium? Which state offers the highest premium?arrow_forwardWing Foot is a shoe franchise commonly found in shopping centers across the United States. Wing Foot knows that its stores will not show a profit unless they gross over $940,000 per year. Let A be the event that a new Wing Foot store grosses over $940,000 its first year. Let B be the event that a store grosses over $940,000 its second year. Wing Foot has an administrative policy of closing a new store if it does not show a profit in either of the first two years. Assume that the accounting office at Wing Foot provided the following information: 58% of all Wing Foot stores show a profit the first year; 72% of all Wing Foot store show a profit the second year (this includes stores that did not show a profit the first year); however, 86% of Wing Foot stores that showed a profit the first year also showed a profit the second year. Compute P(B|Ac). Round your answer to the nearest hundredth.arrow_forward
- You draw two cards from a standard deck of 52 cards, but before you draw the second card, you put the first one back and reshuffle the deck. If you get a3on the first card, find the probability of drawing a 3 for the second card.arrow_forwardDo bonds reduce the overall risk of an investment portfolio? Let x be a random variable representing annual percent return for the Vanguard Total Stock Index (all Stocks). Let y be a random variable representing annual return for the Vanguard Balanced Index (60% stock and 40% bond). For the past several years, assume the following data. Compute the coefficient of variation for each fund. Round your answers to the nearest tenth. x: 14 0 37 21 35 23 24 -14 -14 -17 y: 8 -2 29 17 22 17 17 -2 -3 -8arrow_forwardWhat percentage of the general U.S. population have bachelor's degrees? Suppose that the Statistical Abstract of the United States, 120th Edition, gives the following percentage of bachelor’s degrees by state. For convenience, the data are sorted in increasing order. 17 18 18 18 19 20 20 20 21 21 21 21 21 22 22 22 22 22 23 23 24 24 24 24 24 25 25 25 25 26 26 26 26 26 26 27 27 27 28 28 28 29 29 31 31 32 32 34 35 38 Illinois has a bachelor's degree percentage rate of about 18%. Into what quartile does this rate fall?arrow_forward
- What percentage of the general U.S. population have bachelor's degrees? Suppose that the Statistical Abstract of the United States, 120th Edition, gives the following percentage of bachelor’s degrees by state. For convenience, the data are sorted in increasing order. 17 18 18 18 19 20 20 20 21 21 21 21 21 22 22 22 22 22 23 23 24 24 24 24 24 25 25 25 25 26 26 26 26 26 26 27 27 27 28 28 28 29 29 31 31 32 32 34 35 38 Illinois has a bachelor's degree percentage rate of about 18%. Into what quartile does this rate fall?arrow_forwardFind the range for the following sample data. x 23 17 11 30 27arrow_forwardDo bonds reduce the overall risk of an investment portfolio? Let x be a random variable representing annual percent return for the Vanguard Total Stock Index (all Stocks). Let y be a random variable representing annual return for the Vanguard Balanced Index (60% stock and 40% bond). For the past several years, assume the following data. Compute the sample mean for x and for y. Round your answer to the nearest tenth. x: 11 0 36 22 34 24 25 -11 -11 -22 y: 9 -3 28 14 23 16 14 -3 -4 -9arrow_forward
- Do bonds reduce the overall risk of an investment portfolio? Let x be a random variable representing annual percent return for the Vanguard Total Stock Index (all Stocks). Let y be a random variable representing annual return for the Vanguard Balanced Index (60% stock and 40% bond). For the past several years, assume the following data. Compute the range for variable y. X 12 0 36 21 35 23 24 -12 -12 -21 Y 10 -2 26 15 22 18 15 -2 -3 -10arrow_forwardDo bonds reduce the overall risk of an investment portfolio? Let x be a random variable representing annual percent return for the Vanguard Total Stock Index (all Stocks). Let y be a random variable representing annual return for the Vanguard Balanced Index (60% stock and 40% bond). For the past several years, assume the following data. Compute the range for variable y. X 12 0 36 21 35 23 24 -12 -12 -21 Y 10 -2 26 15 22 18 15 -2 -3 -10arrow_forwardDo bonds reduce the overall risk of an investment portfolio? Let x be a random variable representing annual percent return for the Vanguard Total Stock Index (all Stocks). Let y be a random variable representing annual return for the Vanguard Balanced Index (60% stock and 40% bond). For the past several years, assume the following data. Compute the range for variable x. X 15 0 37 23 33 25 26 -15 -15 -23 Y 6 -1 28 18 24 17 18 -1 -2 -6arrow_forward
 Big Ideas Math A Bridge To Success Algebra 1: Stu...AlgebraISBN:9781680331141Author:HOUGHTON MIFFLIN HARCOURTPublisher:Houghton Mifflin Harcourt
 Glencoe Algebra 1, Student Edition, 9780079039897...AlgebraISBN:9780079039897Author:CarterPublisher:McGraw Hill
 Holt Mcdougal Larson Pre-algebra: Student Edition...AlgebraISBN:9780547587776Author:HOLT MCDOUGALPublisher:HOLT MCDOUGAL
 College Algebra (MindTap Course List)AlgebraISBN:9781305652231Author:R. David Gustafson, Jeff HughesPublisher:Cengage Learning