
Elementary Statistics: Picturing the World (7th Edition)
7th Edition
ISBN: 9780134683416
Author: Ron Larson, Betsy Farber
Publisher: PEARSON
expand_more
expand_more
format_list_bulleted
Concept explainers
Videos
Textbook Question
Chapter 6.1, Problem 46E
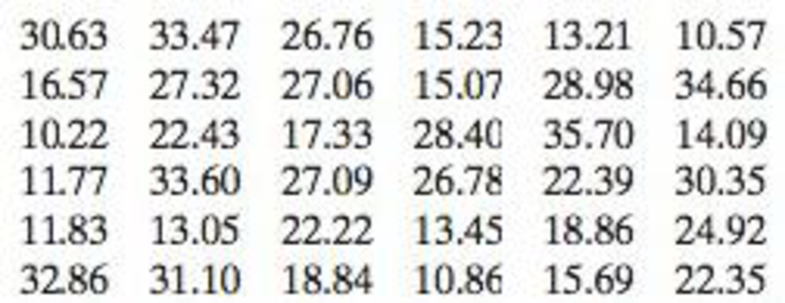
Constructing Confidence Intervals In Exercises 45 and 46, use the information to construct 90% and 99% confidence intervals for the population
46. Sodium Chloride Concentrations The sodium chloride concentrations (in grams per liter) for 36 randomly selected seawater samples are listed. Assume that σ is 7.61 grams per liter.
Expert Solution & Answer
Want to see the full answer?
Check out a sample textbook solution
Students have asked these similar questions
Need help with the following statistic problems.
Need help with the following questions on statistics.
Need help with these following statistic questions.
Chapter 6 Solutions
Elementary Statistics: Picturing the World (7th Edition)
Ch. 6.1 - In Example 1, the researcher selects a second...Ch. 6.1 - Use the data in Try It Yourself 1 and a 95%...Ch. 6.1 - Use the data in Try It Yourself 1 to construct a...Ch. 6.1 - Use the data in Example 1 and technology to...Ch. 6.1 - Construct a 90% confidence interval for the...Ch. 6.1 - In Example 6, how many student-athletes must the...Ch. 6.1 - When estimating a population mean, are you more...Ch. 6.1 - Which statistic is the best unbiased estimator for...Ch. 6.1 - For the same sample statistics, which level of...Ch. 6.1 - You construct a 95% confidence interval for a...
Ch. 6.1 - In Exercises 58, find the critical value Zc...Ch. 6.1 - In Exercises 58, find the critical value Zc...Ch. 6.1 - In Exercises 58, find the critical value Zc...Ch. 6.1 - In Exercises 58, find the critical value Zc...Ch. 6.1 - Graphical Analysis In Exercises 912, use the...Ch. 6.1 - Graphical Analysis In Exercises 912, use the...Ch. 6.1 - Graphical Analysis In Exercises 912, use the...Ch. 6.1 - Graphical Analysis In Exercises 912, use the...Ch. 6.1 - In Exercises 1316, find the margin of error for...Ch. 6.1 - In Exercises 1316, find the margin of error for...Ch. 6.1 - In Exercises 1316, find the margin of error for...Ch. 6.1 - In Exercises 1316, find the margin of error for...Ch. 6.1 - Matching In Exercises 1720, match the level of...Ch. 6.1 - Matching In Exercises 1720, match the level of...Ch. 6.1 - Matching In Exercises 1720, match the level of...Ch. 6.1 - Matching In Exercises 1720, match the level of...Ch. 6.1 - In Exercises 2124, construct the indicated...Ch. 6.1 - In Exercises 2124, construct the indicated...Ch. 6.1 - In Exercises 2124, construct the indicated...Ch. 6.1 - In Exercises 2124, construct the indicated...Ch. 6.1 - In Exercises 2528, use the confidence interval to...Ch. 6.1 - In Exercises 2528, use the confidence interval to...Ch. 6.1 - In Exercises 2528, use the confidence interval to...Ch. 6.1 - In Exercises 2528, use the confidence interval to...Ch. 6.1 - In Exercises 2932, determine the minimum sample...Ch. 6.1 - In Exercises 2932, determine the minimum sample...Ch. 6.1 - In Exercises 2932, determine the minimum sample...Ch. 6.1 - In Exercises 2932, determine the minimum sample...Ch. 6.1 - Finding the Margin of Error In Exercises 33 and...Ch. 6.1 - Finding the Margin of Error In Exercises 33 and...Ch. 6.1 - Constructing Confidence Intervals In Exercises...Ch. 6.1 - Constructing Confidence Intervals In Exercises...Ch. 6.1 - Constructing Confidence Intervals In Exercises...Ch. 6.1 - Constructing Confidence Intervals In Exercises...Ch. 6.1 - In Exercise 35, does it seem possible that the...Ch. 6.1 - In Exercise 36, does it seem possible that the...Ch. 6.1 - In Exercise 37, does it seem possible that the...Ch. 6.1 - In Exercise 38, does it seem possible that the...Ch. 6.1 - When all other quantities remain the same, how...Ch. 6.1 - Constructing Confidence Intervals In Exercises 45...Ch. 6.1 - Constructing Confidence Intervals In Exercises 45...Ch. 6.1 - Determining a Minimum Sample Size Determine the...Ch. 6.1 - Determining a Minimum Sample Size Determine the...Ch. 6.1 - Cholesterol Contents of Cheese A cheese processing...Ch. 6.1 - Ages of College Students An admissions director...Ch. 6.1 - Paint Can Volumes A paint manufacturer uses a...Ch. 6.1 - Juice Dispensing Machine A beverage company uses a...Ch. 6.1 - Soccer Balls A soccer ball manufacturer wants to...Ch. 6.1 - Tennis Balls A tennis ball manufacturer wants to...Ch. 6.1 - When estimating the population mean, why not...Ch. 6.1 - When all other quantities remain the same, how...Ch. 6.1 - Determine the finite population coection factor...Ch. 6.1 - Use the finite population correction factor to...Ch. 6.1 - Sample Size The equation for determining the...Ch. 6.2 - Find the critical value tc for a 90% confidence...Ch. 6.2 - Construct 90% and 99% confidence intervals for the...Ch. 6.2 - Construct 90% and 95% confidence intervals for the...Ch. 6.2 - You randomly select 18 adult male athletes and...Ch. 6.2 - Finding Critical Values of t In Exercises 14, find...Ch. 6.2 - Finding Critical Values of t In Exercises 14, find...Ch. 6.2 - Finding Critical Values of t In Exercises 14, find...Ch. 6.2 - Finding Critical Values of t In Exercises 14, find...Ch. 6.2 - In Exercises 58, find the margin of error for the...Ch. 6.2 - In Exercises 58, find the margin of error for the...Ch. 6.2 - In Exercises 58, find the margin of error for the...Ch. 6.2 - In Exercises 58, find the margin of error for the...Ch. 6.2 - In Exercises 912, construct the indicated...Ch. 6.2 - In Exercises 912, construct the indicated...Ch. 6.2 - In Exercises 912, construct the indicated...Ch. 6.2 - In Exercises 912, construct the indicated...Ch. 6.2 - In Exercises 1316, use the confidence interval to...Ch. 6.2 - In Exercises 1316, use the confidence interval to...Ch. 6.2 - In Exercises 1316, use the confidence interval to...Ch. 6.2 - In Exercises 1316, use the confidence interval to...Ch. 6.2 - Constructing a Confidence Interval In Exercises...Ch. 6.2 - Constructing a Confidence Interval In Exercises...Ch. 6.2 - Constructing a Confidence Interval In Exercises...Ch. 6.2 - Constructing a Confidence Interval In Exercises...Ch. 6.2 - You research commute times to work and find that...Ch. 6.2 - You research driving distances to work and find...Ch. 6.2 - You research prices of cell phones and find that...Ch. 6.2 - You research repair costs of mobile devices and...Ch. 6.2 - Constructing a Confidence Interval in Exercises...Ch. 6.2 - Constructing a Confidence Interval in Exercises...Ch. 6.2 - Constructing a Confidence Interval in Exercises...Ch. 6.2 - Constructing a Confidence Interval in Exercises...Ch. 6.2 - In Exercise 25, the population mean SAT score is...Ch. 6.2 - In Exercise 28, the population mean weekly time...Ch. 6.2 - Constructing a Confidence Interval Ir. Exercises...Ch. 6.2 - Constructing a Confidence Interval Ir. Exercises...Ch. 6.2 - In Exercise 31, the population mean salary is...Ch. 6.2 - In Exercise 32, the population mean salary is...Ch. 6.2 - Choosing a Distribution In Exercises 3538, use the...Ch. 6.2 - Choosing a Distribution In Exercises 3538, use the...Ch. 6.2 - Choosing a Distribution In Exercises 3538, use the...Ch. 6.2 - Choosing a Distribution In Exercises 3538, use the...Ch. 6.2 - In Exercise 36, does it seem possible that the...Ch. 6.2 - In Exercise 38, does it seem possible that the...Ch. 6.2 - Tennis Ball Manufacturing A company manufactures...Ch. 6.2 - Light Bulb Manufacturing A company manufactures...Ch. 6.2 - Prob. 1ACh. 6.2 - In a random sample of 24 high school students, the...Ch. 6.2 - A marathon is a fool race with a distance of 26.22...Ch. 6.2 - A marathon is a fool race with a distance of 26.22...Ch. 6.2 - A marathon is a fool race with a distance of 26.22...Ch. 6.2 - A marathon is a fool race with a distance of 26.22...Ch. 6.2 - A marathon is a fool race with a distance of 26.22...Ch. 6.2 - A marathon is a fool race with a distance of 26.22...Ch. 6.3 - A poll surveyed 4780 U.S. adults about how often...Ch. 6.3 - Use the data in Try It Yourself 1 to construct a...Ch. 6.3 - Use the data in Example 3 to construct a 99%...Ch. 6.3 - A researcher is estimating the population...Ch. 6.3 - True or False? In Exercises 1 and 2, determine...Ch. 6.3 - True or False? In Exercises 1 and 2, determine...Ch. 6.3 - Finding p and q In Exercises 36, let p be the...Ch. 6.3 - Finding p and q In Exercises 36, let p be the...Ch. 6.3 - Finding p and q In Exercises 36, let p be the...Ch. 6.3 - Finding p and q In Exercises 36, let p be the...Ch. 6.3 - In Exercises 710, use the confidence interval to...Ch. 6.3 - In Exercises 710, use the confidence interval to...Ch. 6.3 - In Exercises 710, use the confidence interval to...Ch. 6.3 - In Exercises 710, use the confidence interval to...Ch. 6.3 - Constructing Confidence Intervals In Exercises 11...Ch. 6.3 - Constructing Confidence Intervals In Exercises 11...Ch. 6.3 - Constructing Confidence Intervals In Exercises 13...Ch. 6.3 - Constructing Confidence Intervals In Exercises 13...Ch. 6.3 - LGBT Identification In a survey of 1,626,773 U.S....Ch. 6.3 - Transgender Bathroom Policy In a survey of 1000...Ch. 6.3 - Congress You wish to estimate, with 95%...Ch. 6.3 - Genetically Modified Organisms You wish to...Ch. 6.3 - Fast Food You wish to estimate, with 90%...Ch. 6.3 - Alcohol-Impaired Driving You wish to estimate,...Ch. 6.3 - In Exercise 11, does it seem possible that the...Ch. 6.3 - In Exercise 14, does it seem possible that the...Ch. 6.3 - In Exercise 17(b), would a sample size of 200 be...Ch. 6.3 - In Exercise 20(b), would a sample size of 600 be...Ch. 6.3 - Constructing Confidence Intervals In Exercises 25...Ch. 6.3 - Constructing Confidence Intervals In Exercises 25...Ch. 6.3 - Constructing Confidence Intervals In Exercises 27...Ch. 6.3 - Constructing Confidence Intervals In Exercises 27...Ch. 6.3 - Translating Statements In Exercises 2934,...Ch. 6.3 - Translating Statements In Exercises 2934,...Ch. 6.3 - Prob. 31ECh. 6.3 - Translating Statements In Exercises 2934,...Ch. 6.3 - Prob. 33ECh. 6.3 - Prob. 34ECh. 6.3 - Prob. 35ECh. 6.3 - Prob. 36ECh. 6.3 - Prob. 37ECh. 6.3 - Prob. 1ACh. 6.3 - Prob. 2ACh. 6.4 - Kind the critical values R2 and I2 for a 90%...Ch. 6.4 - Construct the 90% and 95% confidence intervals for...Ch. 6.4 - Does a population have to be normally distributed...Ch. 6.4 - What happens to the shape of the chi-square...Ch. 6.4 - Prob. 3ECh. 6.4 - Finding Critical Values for X2 In Exercises 38,...Ch. 6.4 - Prob. 5ECh. 6.4 - Finding Critical Values for X2 In Exercises 38,...Ch. 6.4 - Finding Critical Values for X2 In Exercises 38,...Ch. 6.4 - Prob. 8ECh. 6.4 - Prob. 9ECh. 6.4 - Prob. 10ECh. 6.4 - Prob. 11ECh. 6.4 - In Exercises 912, construct the indicated...Ch. 6.4 - Prob. 13ECh. 6.4 - Constructing Confidence Intervals In Exercises...Ch. 6.4 - Constructing Confidence Intervals In Exercises...Ch. 6.4 - Constructing Confidence Intervals In Exercises...Ch. 6.4 - Constructing Confidence Intervals In Exercises...Ch. 6.4 - Constructing Confidence Intervals In Exercises...Ch. 6.4 - Constructing Confidence Intervals In Exercises...Ch. 6.4 - Constructing Confidence Intervals In Exercises...Ch. 6.4 - Constructing Confidence Intervals In Exercises...Ch. 6.4 - Constructing Confidence Intervals In Exercises...Ch. 6.4 - Constructing Confidence Intervals In Exercises...Ch. 6.4 - Constructing Confidence Intervals In Exercises...Ch. 6.4 - Prob. 25ECh. 6.4 - Prob. 26ECh. 6.4 - Prob. 27ECh. 6.4 - Prob. 28ECh. 6.4 - Prob. 29ECh. 6 - The waking times (in minutes past 5:00 A.M.) of 40...Ch. 6 - The driving distances (in miles) to work of 30...Ch. 6 - Prob. 6.1.3RECh. 6 - Prob. 6.1.4RECh. 6 - In Exercises 5 and 6, use the confidence interval...Ch. 6 - Prob. 6.1.6RECh. 6 - Prob. 6.1.7RECh. 6 - Prob. 6.1.8RECh. 6 - In Exercises 912, find the critical value tc for...Ch. 6 - In Exercises 912, find the critical value tc for...Ch. 6 - In Exercises 912, find the critical value tc for...Ch. 6 - Prob. 6.2.12RECh. 6 - Prob. 6.2.13RECh. 6 - Prob. 6.2.14RECh. 6 - Prob. 6.2.15RECh. 6 - Prob. 6.2.16RECh. 6 - Prob. 6.2.17RECh. 6 - Prob. 6.2.18RECh. 6 - In Exercises 19-22, let p be the population...Ch. 6 - Prob. 6.3.20RECh. 6 - In Exercises 19-22, let p be the population...Ch. 6 - Prob. 6.3.22RECh. 6 - In Exercise 19, does it seem possible that the...Ch. 6 - Prob. 6.3.24RECh. 6 - Prob. 6.3.25RECh. 6 - Prob. 6.3.26RECh. 6 - Prob. 6.4.27RECh. 6 - Prob. 6.4.28RECh. 6 - Prob. 6.4.29RECh. 6 - In Exercises 2730, find the critical values R2 and...Ch. 6 - Prob. 6.4.31RECh. 6 - In Exercises 31 and 32, assume the sample is from...Ch. 6 - The winning times (in hours) for a sample of 30...Ch. 6 - The data set represents the amounts of time (in...Ch. 6 - Prob. 4CQCh. 6 - Prob. 5CQCh. 6 - Prob. 6CQCh. 6 - Refer to the data set in Exercise 3. Assume the...Ch. 6 - In a survey of 20% U.S. adults, 1740 think...Ch. 6 - The data set represents the weights (in pounds) of...Ch. 6 - The data set represents the scores of 12 randomly...Ch. 6 - Use the standard normal distribution or the...Ch. 6 - The Safe Drinking Water Act, which was passed in...Ch. 6 - The Safe Drinking Water Act, which was passed in...Ch. 6 - The Safe Drinking Water Act, which was passed in...Ch. 6 - Since 1935, the Gallup Organization has conducted...Ch. 6 - THE GALLUP ORGANIZATION www.gallup.com Since 1935,...Ch. 6 - Since 1935, the Gallup Organization has conducted...Ch. 6 - Since 1935, the Gallup Organization has conducted...
Knowledge Booster


Learn more about
Need a deep-dive on the concept behind this application? Look no further. Learn more about this topic, statistics and related others by exploring similar questions and additional content below.Similar questions
- 2PM Tue Mar 4 7 Dashboard Calendar To Do Notifications Inbox File Details a 25/SP-CIT-105-02 Statics for Technicians Q-7 Determine the resultant of the load system shown. Locate where the resultant intersects grade with respect to point A at the base of the structure. 40 N/m 2 m 1.5 m 50 N 100 N/m Fig.- Problem-7 4 m Gradearrow_forwardNsjsjsjarrow_forwardA smallish urn contains 16 small plastic bunnies - 9 of which are pink and 7 of which are white. 10 bunnies are drawn from the urn at random with replacement, and X is the number of pink bunnies that are drawn. (a) P(X=6)[Select] (b) P(X>7) ≈ [Select]arrow_forward
- A smallish urn contains 25 small plastic bunnies - 7 of which are pink and 18 of which are white. 10 bunnies are drawn from the urn at random with replacement, and X is the number of pink bunnies that are drawn. (a) P(X = 5)=[Select] (b) P(X<6) [Select]arrow_forwardElementary StatisticsBase on the same given data uploaded in module 4, will you conclude that the number of bathroom of houses is a significant factor for house sellprice? I your answer is affirmative, you need to explain how the number of bathroom influences the house price, using a post hoc procedure. (Please treat number of bathrooms as a categorical variable in this analysis)Base on the same given data, conduct an analysis for the variable sellprice to see if sale price is influenced by living area. Summarize your finding including all regular steps (learned in this module) for your method. Also, will you conclude that larger house corresponding to higher price (justify)?Each question need to include a spss or sas output. Instructions: You have to use SAS or SPSS to perform appropriate procedure: ANOVA or Regression based on the project data (provided in the module 4) and research question in the project file. Attach the computer output of all key steps (number) quoted in…arrow_forwardElementary StatsBase on the given data uploaded in module 4, change the variable sale price into two categories: abovethe mean price or not; and change the living area into two categories: above the median living area ornot ( your two group should have close number of houses in each group). Using the resulting variables,will you conclude that larger house corresponding to higher price?Note: Need computer output, Ho and Ha, P and decision. If p is small, you need to explain what type ofdependency (association) we have using an appropriate pair of percentages. Please include how to use the data in SPSS and interpretation of data.arrow_forward
- An environmental research team is studying the daily rainfall (in millimeters) in a region over 100 days. The data is grouped into the following histogram bins: Rainfall Range (mm) Frequency 0-9.9 15 10 19.9 25 20-29.9 30 30-39.9 20 ||40-49.9 10 a) If a random day is selected, what is the probability that the rainfall was at least 20 mm but less than 40 mm? b) Estimate the mean daily rainfall, assuming the rainfall in each bin is uniformly distributed and the midpoint of each bin represents the average rainfall for that range. c) Construct the cumulative frequency distribution and determine the rainfall level below which 75% of the days fall. d) Calculate the estimated variance and standard deviation of the daily rainfall based on the histogram data.arrow_forwardAn electronics company manufactures batches of n circuit boards. Before a batch is approved for shipment, m boards are randomly selected from the batch and tested. The batch is rejected if more than d boards in the sample are found to be faulty. a) A batch actually contains six faulty circuit boards. Find the probability that the batch is rejected when n = 20, m = 5, and d = 1. b) A batch actually contains nine faulty circuit boards. Find the probability that the batch is rejected when n = 30, m = 10, and d = 1.arrow_forwardTwenty-eight applicants interested in working for the Food Stamp program took an examination designed to measure their aptitude for social work. A stem-and-leaf plot of the 28 scores appears below, where the first column is the count per branch, the second column is the stem value, and the remaining digits are the leaves. a) List all the values. Count 1 Stems Leaves 4 6 1 4 6 567 9 3688 026799 9 8 145667788 7 9 1234788 b) Calculate the first quartile (Q1) and the third Quartile (Q3). c) Calculate the interquartile range. d) Construct a boxplot for this data.arrow_forward
- Pam, Rob and Sam get a cake that is one-third chocolate, one-third vanilla, and one-third strawberry as shown below. They wish to fairly divide the cake using the lone chooser method. Pam likes strawberry twice as much as chocolate or vanilla. Rob only likes chocolate. Sam, the chooser, likes vanilla and strawberry twice as much as chocolate. In the first division, Pam cuts the strawberry piece off and lets Rob choose his favorite piece. Based on that, Rob chooses the chocolate and vanilla parts. Note: All cuts made to the cake shown below are vertical.Which is a second division that Rob would make of his share of the cake?arrow_forwardThree players (one divider and two choosers) are going to divide a cake fairly using the lone divider method. The divider cuts the cake into three slices (s1, s2, and s3). If the choosers' declarations are Chooser 1: {s1 , s2} and Chooser 2: {s2 , s3}. Using the lone-divider method, how many different fair divisions of this cake are possible?arrow_forwardTheorem 2.6 (The Minkowski inequality) Let p≥1. Suppose that X and Y are random variables, such that E|X|P <∞ and E|Y P <00. Then X+YpX+Yparrow_forward
arrow_back_ios
SEE MORE QUESTIONS
arrow_forward_ios
Recommended textbooks for you
 Glencoe Algebra 1, Student Edition, 9780079039897...AlgebraISBN:9780079039897Author:CarterPublisher:McGraw Hill
 Big Ideas Math A Bridge To Success Algebra 1: Stu...AlgebraISBN:9781680331141Author:HOUGHTON MIFFLIN HARCOURTPublisher:Houghton Mifflin Harcourt
Glencoe Algebra 1, Student Edition, 9780079039897...
Algebra
ISBN:9780079039897
Author:Carter
Publisher:McGraw Hill
Big Ideas Math A Bridge To Success Algebra 1: Stu...
Algebra
ISBN:9781680331141
Author:HOUGHTON MIFFLIN HARCOURT
Publisher:Houghton Mifflin Harcourt
Hypothesis Testing - Solving Problems With Proportions; Author: The Organic Chemistry Tutor;https://www.youtube.com/watch?v=76VruarGn2Q;License: Standard YouTube License, CC-BY
Hypothesis Testing and Confidence Intervals (FRM Part 1 – Book 2 – Chapter 5); Author: Analystprep;https://www.youtube.com/watch?v=vth3yZIUlGQ;License: Standard YouTube License, CC-BY