![Elementary Statistics: Picturing the World (7th Edition)](https://www.bartleby.com/isbn_cover_images/9780134683416/9780134683416_largeCoverImage.gif)
The Safe Drinking Water Act, which was passed in 1974, allows the Environmental Protection Agency (EPA) to regulate the levels of contaminants in drinking water. The EPA requires that water utilities give their customers water quality reports annually. These reports include the results of daily water quality monitoring, which is performed to determine whether drinking water is safe for consumption.
A water department tests for contaminants at water treatment plants and at customers laps. These contaminants include microorganisms, organic chemicals, and inorganic chemicals such as cyanide. Cyanide’s presence in drinking water is the result of discharges from Steel, plastics, and fertilizer factories. For drinking water, the maximum contaminant level of cyanide is 0.2 part per million.
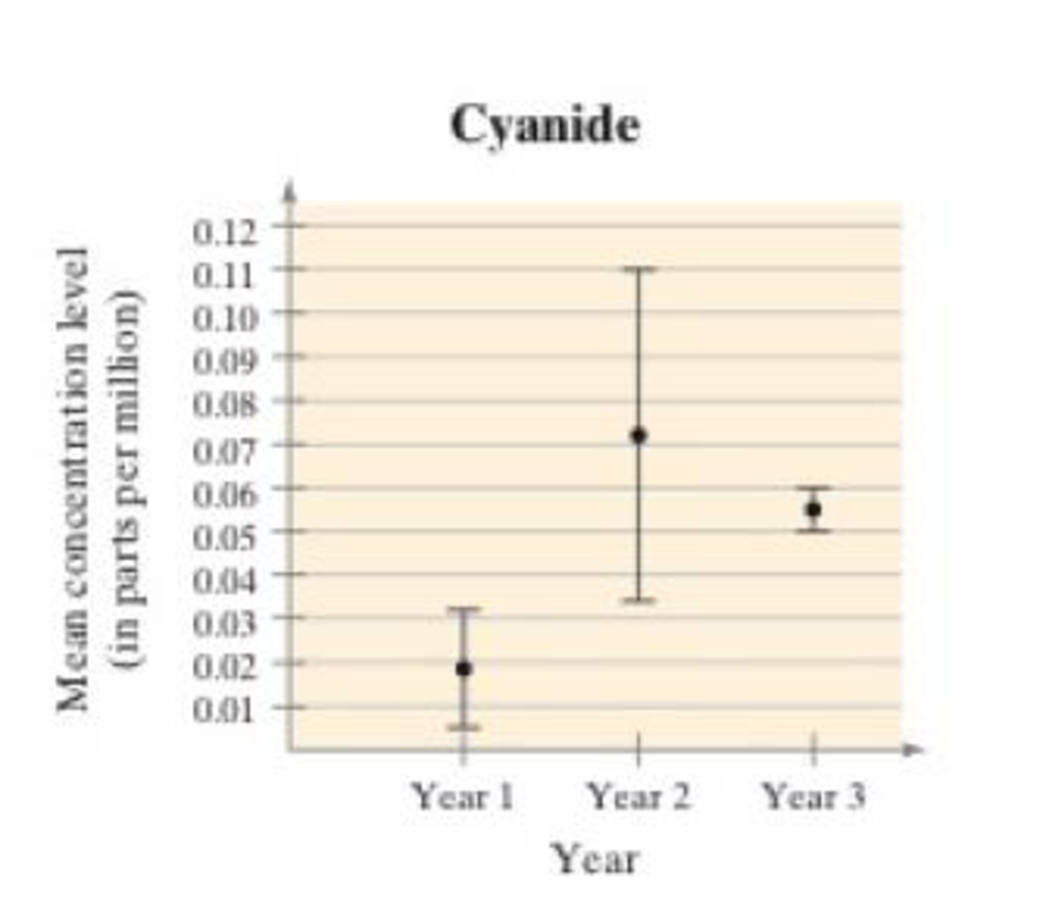
As part of your job for your city’s water department, you are preparing a report that includes an analysis of the results shown in the figure at the right. The figure shows the point estimates for the population mean concentration and the 95% confidence intervals for μ for cyanide over a three-year period. The data are based on random water samples taken by the city’s three water treatment plants.
3. What Do You Think?
The confidence interval for Year 2 is much larger than the other years. What do you think may have caused this larger confidence level?
![Check Mark](/static/check-mark.png)
Want to see the full answer?
Check out a sample textbook solution![Blurred answer](/static/blurred-answer.jpg)
Chapter 6 Solutions
Elementary Statistics: Picturing the World (7th Edition)
- Cholesterol Cholesterol in human blood is necessary, but too much can lead to health problems. There are three main types of cholesterol: HDL (high-density lipoproteins), LDL (low-density lipoproteins), and VLDL (very low-density lipoproteins). HDL is considered “good” cholesterol; LDL and VLDL are considered “bad” cholesterol. A standard fasting cholesterol blood test measures total cholesterol, HDL cholesterol, and triglycerides. These numbers are used to estimate LDL and VLDL, which are difficult to measure directly. Your doctor recommends that your combined LDL/VLDL cholesterol level be less than 130 milligrams per deciliter, your HDL cholesterol level be at least 60 milligrams per deciliter, and your total cholesterol level be no more than 200 milligrams per deciliter. (a) Write a system of linear inequalities for the recommended cholesterol levels. Let x represent the HDL cholesterol level, and let y represent the combined LDL VLDL cholesterol level. (b) Graph the system of inequalities from part (a). Label any vertices of the solution region. (c) Is the following set of cholesterol levels within the recommendations? Explain. LDL/VLDL: 120 milligrams per deciliter HDL: 90 milligrams per deciliter Total: 210 milligrams per deciliter (d) Give an example of cholesterol levels in which the LDL/VLDL cholesterol level is too high but the HDL cholesterol level is acceptable. (e) Another recommendation is that the ratio of total cholesterol to HDL cholesterol be less than 4 (that is, less than 4 to 1). Identify a point in the solution region from part (b) that meets this recommendation, and explain why it meets the recommendation.arrow_forwardWhat do people actually order at Chipotle? How healthy is a normal Chipotle meal? Chipotle and other relatively new healthier menu choices than the traditional fast food outlets like McDonald's, Taco Bell, Burger King, etc. fast casual chains like Shake Shack, Potbelly and Five Guys typically promote themselves as having The recommended daily calorie intake for most adults is 1,600 to 2,400. The histogram below shows the calories in approximately 3,000 meals ordered from Chipotle on Grubhub. Many burritos and burrito bowls end up with 900 to 1,000 calories. Recommended dietary allowance 2,000 calories 6% of meals 5% This small bump is 4% mostly from sides of chips and guacamole. 3% 2% About 2 percent of meals had more than 2,000 calories. 1% 200 400 600 800 1,000 1,200 1,400 1,600 1,800 2,000 2,200 2,400 2,600 2,800 While the histogram not perfectly symmetric (there is mild right skewness), it is close enough to being symmetric and bell-shaped to justify using the 68-95-99.7 rule.…arrow_forwardThe quantity of dissolved oxygen is a measure of water pollution in lakes, rivers, and streams. Water samples were taken at four different locations in a river in an effort to determine if water pollution varied from location to location. Location I was 500 meters above an industrial plant water discharge point and near the shore. Location II was 200 meters above the discharge point and in midstream. Location III was 50 meters downstream from the discharge point and near the shore. Location IV was 200 meters downstream from the discharge point and in midstream. The following table shows the results. Lower dissolved oxygen readings mean more pollution. Because of the difficulty in getting midstream samples, ecology students collecting the data had fewer of these samples. Use a 5% level of significance. Do we reject or not reject the claim that the quantity of dissolved oxygen does not vary from one location to another? Location I Location II Location III Location IV 7.1 6.6 4.6…arrow_forward
- The quantity of dissolved oxygen is a measure of water pollution in lakes, rivers, and streams. Water samples were taken at four different locations in a river in an effort to determine if water pollution varied from location to location. Location I was 500 meters above an industrial plant water discharge point and near the shore. Location II was 200 meters above the discharge point and in midstream. Location III was 50 meters downstream from the discharge point and near the shore. Location IV was 200 meters downstream from the discharge point and in midstream. The following table shows the results. Lower dissolved oxygen readings mean more pollution. Because of the difficulty in getting midstream samples, ecology students collecting the data had fewer of these samples. Use a 1%level of significance. Do we reject or not reject the claim that the quantity of dissolved oxygen does not vary from one location to another? Location I Location II Location III Location IV 7.6 6.7 4.8 4.9…arrow_forwardThe quantity of dissolved oxygen is a measure of water pollution in lakes, rivers, and streams. Water samples were taken at four different locations in a river in an effort to determine if water pollution varied from location to location. Location I was 500 meters above an industrial plant water discharge point and near the shore. Location II was 200 meters above the discharge point and in midstream. Location III was 50 meters downstream from the discharge point and near the shore. Location IV was 200 meters downstream from the discharge point and in midstream. The following table shows the results. Lower dissolved oxygen readings mean more pollution. Because of the difficulty in getting midstream samples, ecology students collecting the data had fewer of these samples. Use a 5% level of significance. Do we reject or not reject the claim that the quantity of dissolved oxygen does not vary from one location to another? Location I Location II Location III Location IV 7.4 6.3 4.5…arrow_forwardThe quantity of dissolved oxygen is a measure of water pollution in lakes, rivers, and streams. Water samples were taken at four different locations in a river in an effort to determine if water pollution varied from location to location. Location I was 500 meters above an industrial plant water discharge point and near the shore. Location II was 200 meters above the discharge point and in midstream. Location III was 50 meters downstream from the discharge point and near the shore. Location IV was 200 meters downstream from the discharge point and in midstream. The following table shows the results. Lower dissolved oxygen readings mean more pollution. Because of the difficulty in getting midstream samples, ecology students collecting the data had fewer of these samples. Use a 5% level of significance. Do we reject or not reject the claim that the quantity of dissolved oxygen does not vary from one location to another? Location I Location II Location III Location IV 7.6 6.3 4.6…arrow_forward
- State if these variables would be expected to have a positive, negative, or no association. A. Number of schools and population size. o Positive Negative No association B. Income and number of health conditions. Positive o Negative No association C. Time spent meditating and stress level. Positive o Negative No association D. Number of pets and amount of money spent on printer ink. Positive Negative o No association E. Life expectancy and death rate. Positive Negative o No associationarrow_forwardA reseacher desires to know if the age of a child is related to the number of cavities he or she has.arrow_forwardBelow are two data sets, one for the average retail price of gasoline in the State of California for each month in 2005, and the other for the average retail price of gasoline in the State of Texas for each month in 2005.This data is from the U.S. Department of Energy (units are dollars per gallon). California Texas Calif. + 3 Jan 2.016 1.773 Feb 2.163 1.841 Mar 2.346 2.008 Apr 2.596 2.169 May 2.52 2.088 Jun 2.41 2.101 Jul 2.559 2.227 Aug 2.721 2.446 Sept 3.032 2.843 Oct 2.926 2.72 Nov 2.57 2.204 Dec 2.319 2.161 SUM MEAN STDEV MEDIAN RANGE 1. Compare the sum, the mean, the standard deviation, the median, and the range of DATA SET B and DATA SET D. What happened to these summary statistics when you added 3 to each observation from the California data set? 2. In general, what happens to the the mean, the median, the standard deviation, and the range of a data set when a constant…arrow_forward
- Identify the explanatory variable and the response variable. An agricultural business wants to determine if the rainfall in inches can be used to predict the yield per acre on a wheat farm.arrow_forwardplease answer questionarrow_forwardJohnson Filtration, Inc. provides maintenance service for water-filtration systems. Suppose that in addition to information on the number of months since the machine was serviced and whether a mechanical or an electrical repair was necessary, the managers obtained a list showing which repairperson performed the service. The revised data follow. Click on the datafile logo to reference the data. DATA file Repair Time Months Since in Hours Last Service Type of Repair Repairperson 2.9 Electrical Dave Newton 3.0 Mechanical Dave Newton 4.8 8. Electrical Bob Jones 1.8 Mechanical Dave Newton 2.9 Electrical Dave Newton 4.9 Electrical Bob Jones 4.2 6. Mechanical Bob Jones 4.8 8. Mechanical Bob Jones 4.4 4. Electrical Bob Jones 4.5 Electrical Dave Newton a. Ignore for now the months since the last maintenance service (1 ) and the repairperson who performed the service. Develop the estimated simpe linear regression equation to predict the repair time (y) given the type of repair (2 ). Recall that…arrow_forward
- Linear Algebra: A Modern IntroductionAlgebraISBN:9781285463247Author:David PoolePublisher:Cengage Learning
![Text book image](https://www.bartleby.com/isbn_cover_images/9781337282291/9781337282291_smallCoverImage.gif)
![Text book image](https://www.bartleby.com/isbn_cover_images/9781285463247/9781285463247_smallCoverImage.gif)