
Interpretation:
From the given experimental data both in absence and presence of its inhibitor a Lineweaver–Burk plot is to be drawn and values of
Concept introduction:
An inhibitor may be defined as a molecule that binds with the enzymes and decreases the activity of enzyme toward the substrate and this decrease in enzyme activity is called enzymatic inhibition.
Enzymatic inhibition can be of many types. When substrate and inhibitor of an enzyme compete with each other to bind with the enzyme and both of them are structurally same it is known as competitive inhibition. On the other hand, when inhibitors don’t compete with the substrate and both of them can bind to the enzyme at their specific site present on the substrate it is known as noncompetitive inhibition.
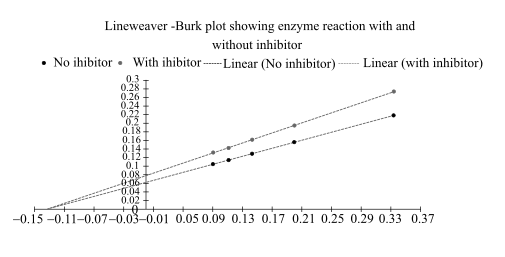
To determine the rate of the reaction, experimental data must be put into Lineweaver Burk plot where the x-axis represents the values of
Answer to Problem 60RE
Plot the reciprocal of substrate concentration along the x-axis and the reciprocal of velocities (both in the presence and absence of inhibitors) along the y-axis.
Before drawing the plot, the data needs to be modified so that it can be put into Lineweaver–Burk plot. The modification of the data is
The Lineweaver–Burk plot from above data is as follows:
From this plot,
Or,
The value
So, the value of
The
The value of
By comparing these two plots it can be said that it is a type of noncompetitive inhibition.
Explanation of Solution
In the case of competitive inhibition, the substrate and inhibitor compete with each other to bind with the active site of the enzyme. By increasing substrate concentration, the effect of competitive inhibition can be discarded. In high substrate concentration
In the case of non-competitive inhibition, inhibitors bind with the allosteric site of the enzyme and enzyme itself can bind with both substrate and inhibitors. It is possible because it has two different sites for both inhibitor and substrate. When the inhibitor binds with an enzyme it blocks its activity even if the substrate is also bound to the enzyme. These inhibitors do not change the substrate affinity of the enzyme so the
In this Lineweaver Burk plot,
The
Want to see more full solutions like this?
Chapter 6 Solutions
BIOCHEMISTRY (LOOSELEAF) >CUSTOM PKG<

- To map the active site of -lactamase, the enzyme was hydrolyzed with trypsin to yield a hexapeptide (P1) with the following amino acids. Glu, Lys, Leu, Phe, Met, and Ser. Treatment of P1 with phenyl isothiocyanate yielded a PTH derivative of phenylalanine and a peptide (P2). Treatment of P1 with cyanogenbromide gave an acidic tetrapeptide (P3) and a dipeptide (P4).Treatment of P2 with 1-fluoro-2,4-dinitrobenzene, followed by complete hydrolysis, yields N-2,4-dinitrophenyl-Glu. P1, P2, and P3 contain the active site serine. question: the b-lactamase hydrolyzes the lactam-ring in antibiotics like penicillin. Describe the mechanism, of hydrolysis, insuring to include the involvement of S, D, and K in the reaction sequence. Please help!arrow_forwardThree of these amino acids participate in the proteolytic hydrolysis of polypeptides. Show the charge-relay network generated by the serine proteases and identify the nucleophilic species that initiates the hydrolysis. please help!arrow_forwardYou have isolated a protein and determined that the native molecular weight of the holoenzyme is 160 kD using size exclusion chromatography. Analysis of this protein using SDS-PAGE revealed 2 bands, one at 100 kD and one at 30 kD. 1. Describe the architecture of the polypeptide component of this enzyme. 2. The enzyme was found to be 0.829% NAD (by weight). What further can be said regarding the architecture? can you please help me with question number 2arrow_forward
- To map the active site of -lactamase, the enzyme was hydrolyzed with trypsin to yield a hexapeptide (P1) with the following amino acids. Glu, Lys, Leu, Phe, Met, and Ser. Treatment of P1 with phenyl isothiocyanate yielded a PTH derivative of phenylalanine and a peptide (P2). Treatment of P1 with cyanogenbromide gave an acidic tetrapeptide (P3) and a dipeptide (P4).Treatment of P2 with 1-fluoro-2,4-dinitrobenzene, followed by complete hydrolysis, yields N-2,4-dinitrophenyl-Glu. P1, P2, and P3 contain the active site serine. Question: although S, K, and D are involved in the catalysis, the E in this hexapeptide does not participate in the hydrolysis of the b-lactam ring. Why is that?arrow_forwardTo map the active site of beta-lactamase, the enzyme was hydrolyzed with trypsin to yield a hexapeptide (P1) with the following amino acids. Glu, Lys, Leu, Phe, Met, and Ser. a) Using the experimental results described below deduce the primary sequence of the active site hexapeptide. Treatment of P1 with phenyl isothiocyanate yielded a PTH derivative of phenylalanine and a peptide (P2). Treatment of P1 with cyanogenbromide gave an acidic tetrapeptide (P3) and a dipeptide (P4).Treatment of P2 with 1-fluoro-2,4-dinitrobenzene, followed by complete hydrolysis, yields N-2,4-dinitrophenyl-Glu. P1, P2, and P3 contain the active site serine. please help!arrow_forwardThe beta-lactamase hydrolyzes the lactam-ring in penicillin. Describe the mechanism of hydrolysis, insuring to include the involvement of S, D, & K in the reaction sequence. Please helparrow_forward
- To map the active site of beta-lactamase, the enzyme was hydrolyzed with trypsin to yield a hexapeptide (P1) with the following amino acids. Glu, Lys, Leu, Phe, Met, and Ser. Treatment of P1 with phenyl isothiocyanate yielded a PTH derivative of phenylalanine and a peptide (P2). Treatment of P1 with cyanogenbromide gave an acidic tetrapeptide (P3) and a dipeptide (P4).Treatment of P2 with 1-fluoro-2,4-dinitrobenzene, followed by complete hydrolysis, yields N-2,4-dinitrophenyl-Glu. P1, P2, and P3 contain the active site serine. Why doesn't D in this hexapeptide not participate in the hydrolysis of the beta-lactam ring even though S, K, and D are involved in the catalyst?arrow_forwardTo map the active site of -lactamase, the enzyme was hydrolyzed with trypsin to yield a hexapeptide (P1) with the following amino acids. Glu, Lys, Leu, Phe, Met, and Ser. Treatment of P1 with phenyl isothiocyanate yielded a PTH derivative of phenylalanine and a peptide (P2). Treatment of P1 with cyanogenbromide gave an acidic tetrapeptide (P3) and a dipeptide (P4).Treatment of P2 with 1-fluoro-2,4-dinitrobenzene, followed by complete hydrolysis, yields N-2,4-dinitrophenyl-Glu. P1, P2, and P3 contain the active site serine. Using the experimental results described above derive the primary sequence of the active site hexapeptide. Please help!arrow_forwardWhich type of enzyme catalyses the following reaction? oxidoreductase, transferase, hydrolase, lyase, isomerase, or ligase.arrow_forward
- +NH+ CO₂ +P H₂N + ATP H₂N NH₂ +ADParrow_forwardWhich type of enzyme catalyses the following reaction? oxidoreductase, transferase, hydrolase, lyase, isomerase, or ligase.arrow_forwardWhich features of the curves in Figure 30-2 indicates that the enzyme is not consumed in the overall reaction? ES is lower in energy that E + S and EP is lower in energy than E + P. What does this tell you about the stability of ES versus E + S and EP versus E + P.arrow_forward
 BiochemistryBiochemistryISBN:9781305961135Author:Mary K. Campbell, Shawn O. Farrell, Owen M. McDougalPublisher:Cengage Learning