
Fundamentals of Biostatistics
8th Edition
ISBN: 9781305268920
Author: Bernard Rosner
Publisher: Cengage Learning
expand_more
expand_more
format_list_bulleted
Concept explainers
Videos
Textbook Question
Chapter 6, Problem 51P
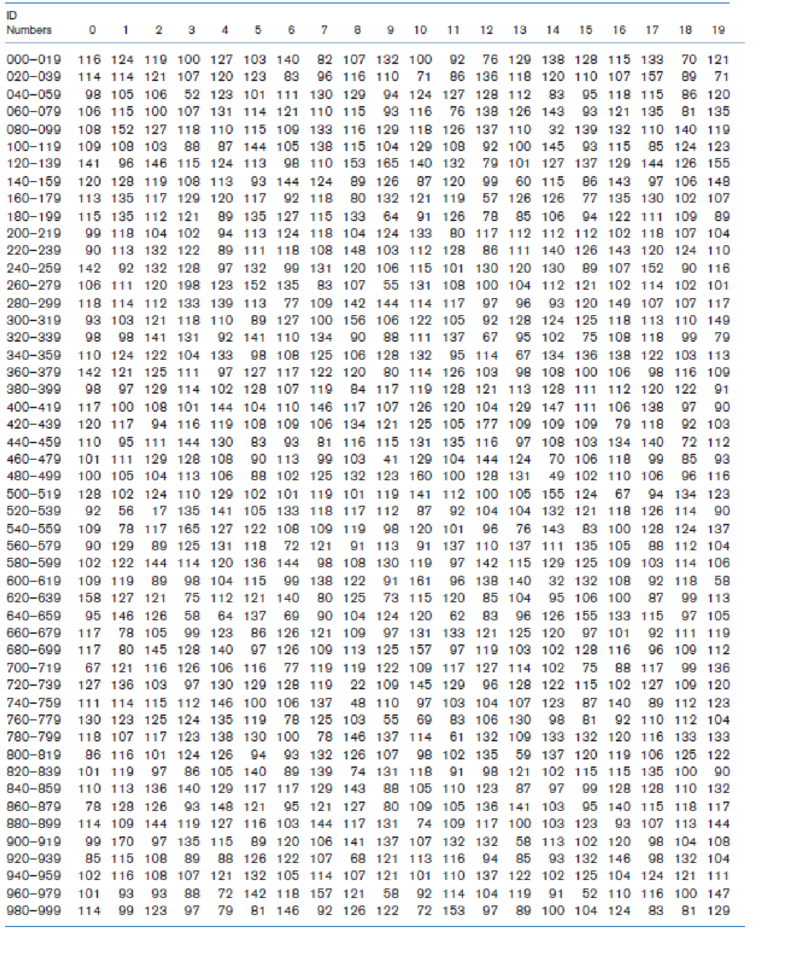
Draw six random samples of size 5 from the data in Table 6.2 (p. 160). The data in Table 6.2 are also available in the Data Set BIRTHWEIGHT.DAT at www.cengagebrain.com.
How do the actual sample results in Problems 6.48 and 6.49 compare?
Table 6.2 Sample of birthweights (oz) obtained from 1000 consecutive deliveries at Boston City Hospital
Expert Solution & Answer
Want to see the full answer?
Check out a sample textbook solution
Students have asked these similar questions
Business
https://www.hawkeslearning.com/Statistics/dbs2/datasets.html
NC Current Students - North Ce X | NC Canvas Login Links - North ( X
Final Exam Comprehensive x Cengage Learning
x
WASTAT - Final Exam - STAT
→
C
webassign.net/web/Student/Assignment-Responses/submit?dep=36055360&tags=autosave#question3659890_9
Part (b)
Draw a scatter plot of the ordered pairs.
N
Life
Expectancy
Life
Expectancy
80
70
600
50
40
30
20
10
Year of
1950
1970 1990
2010 Birth
O
Life
Expectancy
Part (c)
800
70
60
50
40
30
20
10
1950
1970 1990
W
ALT
林
$
#
4
R
J7
Year of
2010 Birth
F6
4+
80
70
60
50
40
30
20
10
Year of
1950 1970 1990
2010 Birth
Life
Expectancy
Ox
800
70
60
50
40
30
20
10
Year of
1950 1970 1990 2010 Birth
hp
P.B.
KA
&
7
80
% 5
H
A
B
F10
711
N
M
K
744
PRT SC
ALT
CTRL
Chapter 6 Solutions
Fundamentals of Biostatistics
Ch. 6.5 - What is the difference between a standard...Ch. 6.5 - What does a 95% CI mean?Ch. 6 - Suppose we are asked to construct a list of...Ch. 6 - Suppose we are asked to construct a list of...Ch. 6 - Suppose we are asked to construct a list of...Ch. 6 - Suppose we are asked to construct a list of...Ch. 6 - The data in Table 6.10 concern the mean triceps...Ch. 6 - The data in Table 6.10 concern the mean triceps...Ch. 6 - The data in Table 6.10 concern the mean triceps...Ch. 6 - The data in Table 6.10 concern the mean triceps...
Ch. 6 - The data in Table 6.10 concern the mean triceps...Ch. 6 - The data in Table 6.10 concern the mean triceps...Ch. 6 - Refer to the data in Table 2.13. Regard this...Ch. 6 - Refer to the data in Table 2.13. Regard this...Ch. 6 - Refer to the data in Table 2.13. Regard this...Ch. 6 - Refer to the data in Table 2.13. Regard this...Ch. 6 - Refer to the data in Table 2.13. Regard this...Ch. 6 - Refer to the data in Table 2.13. Regard this...Ch. 6 - Refer to the data in Table 2.13. Regard this...Ch. 6 - A nine-laboratory cooperative study was performed...Ch. 6 - A nine-laboratory cooperative study was performed...Ch. 6 - A nine-laboratory cooperative study was performed...Ch. 6 - A nine-laboratory cooperative study was performed...Ch. 6 - A nine-laboratory cooperative study was performed...Ch. 6 - A study of psychological and physiological health...Ch. 6 - A study of psychological and physiological health...Ch. 6 - A study is conducted to test the hypothesis that...Ch. 6 - A study is conducted to test the hypothesis that...Ch. 6 - Suppose a clinical trial is conducted to test the...Ch. 6 - Suppose a clinical trial is conducted to test the...Ch. 6 - Suppose a clinical trial is conducted to test the...Ch. 6 - Suppose we want to estimate the concentration...Ch. 6 - Suppose we want to estimate the concentration...Ch. 6 - Suppose we want to estimate the concentration...Ch. 6 - Much discussion has taken place concerning...Ch. 6 - Much discussion has taken place concerning...Ch. 6 - Much discussion has taken place concerning...Ch. 6 - A new assay is developed to obtain the...Ch. 6 - A new assay is developed to obtain the...Ch. 6 - A new assay is developed to obtain the...Ch. 6 - A new assay is developed to obtain the...Ch. 6 - Suppose 100 hypertensive people are given an...Ch. 6 - Suppose 100 hypertensive people are given an...Ch. 6 - Suppose 100 hypertensive people are given an...Ch. 6 - Suppose we decide a better measure of the...Ch. 6 - Suppose we decide a better measure of the...Ch. 6 - Suppose we decide a better measure of the...Ch. 6 - Suppose we decide a better measure of the...Ch. 6 - Draw six random samples of size 5 from the data in...Ch. 6 - Draw six random samples of size 5 from the data in...Ch. 6 - Draw six random samples of size 5 from the data in...Ch. 6 - Draw six random samples of size 5 from the data in...Ch. 6 - Draw six random samples of size 5 from the data in...Ch. 6 - Figure 6.4b (p. 172) plotted the sampling...Ch. 6 - Figure 6.4b (p. 172) plotted the sampling...Ch. 6 - Figure 6.4b (p. 172) plotted the sampling...Ch. 6 - Figure 6.4b (p. 172) plotted the sampling...Ch. 6 - The etiology of high blood pressure remains a...Ch. 6 - The etiology of high blood pressure remains a...Ch. 6 - The etiology of high blood pressure remains a...Ch. 6 - Data Set SEXRAT.DAT, at www.cengagebrain.com,...Ch. 6 - A cohort of hemophiliacs is followed to elicit...Ch. 6 - A cohort of hemophiliacs is followed to elicit...Ch. 6 - A cohort of hemophiliacs is followed to elicit...Ch. 6 - We have previously described Data Set LEAD.DAT (at...Ch. 6 - We have previously described Data Set LEAD.DAT (at...Ch. 6 - We have previously described Data Set LEAD.DAT (at...Ch. 6 - Data Set NIFED.DAT (at www.cengagebrain.com) was...Ch. 6 - Data Set NIFED.DAT (at www.cengagebrain.com) was...Ch. 6 - Data Set NIFED.DAT (at www.cengagebrain.com) was...Ch. 6 - Suppose that there are 6 deaths due to bladder...Ch. 6 - Suppose that there are 4 deaths due to stomach...Ch. 6 - The value of mammography as a screening test for...Ch. 6 - The value of mammography as a screening test for...Ch. 6 - The value of mammography as a screening test for...Ch. 6 - The value of mammography as a screening test for...Ch. 6 - On the computer, draw 1000 bootstrap samples of...Ch. 6 - On the computer, draw 1000 bootstrap samples of...Ch. 6 - A study was performed to investigate the...Ch. 6 - A study was performed to investigate the...Ch. 6 - Refer to Data Set BONEDEN.DAT at...Ch. 6 - Refer to Data Set BONEDEN.DAT at...Ch. 6 - Prob. 88PCh. 6 - Prob. 89PCh. 6 - Prob. 90PCh. 6 - Prob. 91PCh. 6 - Prob. 92PCh. 6 - Prob. 93PCh. 6 - Prob. 94PCh. 6 - Prob. 95PCh. 6 - Prob. 96PCh. 6 - A patient who is taking antihypertensive...Ch. 6 - A patient who is taking antihypertensive...Ch. 6 - A patient who is taking antihypertensive...Ch. 6 - A patient who is taking antihypertensive...Ch. 6 - A patient who is taking antihypertensive...Ch. 6 - Injuries are common in football and may be related...Ch. 6 - Injuries are common in football and may be related...Ch. 6 - A hypertensive patient has been on...Ch. 6 - A hypertensive patient has been on...Ch. 6 - A hypertensive patient has been on...Ch. 6 - A hypertensive patient has been on...Ch. 6 - A radiologist investigates whether a new (less...Ch. 6 - A radiologist investigates whether a new (less...Ch. 6 - The estimation of allele probabilities is...Ch. 6 - The estimation of allele probabilities is...Ch. 6 - The estimation of allele probabilities is...Ch. 6 - As an experiment, 10,000 people are completely...Ch. 6 - As an experiment, 10,000 people are completely...Ch. 6 - Which of the following sample results yields a 95%...Ch. 6 - Suppose we observe 30 cases of colon cancer over...
Knowledge Booster


Learn more about
Need a deep-dive on the concept behind this application? Look no further. Learn more about this topic, statistics and related others by exploring similar questions and additional content below.Similar questions
- Harvard University California Institute of Technology Massachusetts Institute of Technology Stanford University Princeton University University of Cambridge University of Oxford University of California, Berkeley Imperial College London Yale University University of California, Los Angeles University of Chicago Johns Hopkins University Cornell University ETH Zurich University of Michigan University of Toronto Columbia University University of Pennsylvania Carnegie Mellon University University of Hong Kong University College London University of Washington Duke University Northwestern University University of Tokyo Georgia Institute of Technology Pohang University of Science and Technology University of California, Santa Barbara University of British Columbia University of North Carolina at Chapel Hill University of California, San Diego University of Illinois at Urbana-Champaign National University of Singapore McGill…arrow_forwardName Harvard University California Institute of Technology Massachusetts Institute of Technology Stanford University Princeton University University of Cambridge University of Oxford University of California, Berkeley Imperial College London Yale University University of California, Los Angeles University of Chicago Johns Hopkins University Cornell University ETH Zurich University of Michigan University of Toronto Columbia University University of Pennsylvania Carnegie Mellon University University of Hong Kong University College London University of Washington Duke University Northwestern University University of Tokyo Georgia Institute of Technology Pohang University of Science and Technology University of California, Santa Barbara University of British Columbia University of North Carolina at Chapel Hill University of California, San Diego University of Illinois at Urbana-Champaign National University of Singapore…arrow_forwardA company found that the daily sales revenue of its flagship product follows a normal distribution with a mean of $4500 and a standard deviation of $450. The company defines a "high-sales day" that is, any day with sales exceeding $4800. please provide a step by step on how to get the answers in excel Q: What percentage of days can the company expect to have "high-sales days" or sales greater than $4800? Q: What is the sales revenue threshold for the bottom 10% of days? (please note that 10% refers to the probability/area under bell curve towards the lower tail of bell curve) Provide answers in the yellow cellsarrow_forward
- Find the critical value for a left-tailed test using the F distribution with a 0.025, degrees of freedom in the numerator=12, and degrees of freedom in the denominator = 50. A portion of the table of critical values of the F-distribution is provided. Click the icon to view the partial table of critical values of the F-distribution. What is the critical value? (Round to two decimal places as needed.)arrow_forwardA retail store manager claims that the average daily sales of the store are $1,500. You aim to test whether the actual average daily sales differ significantly from this claimed value. You can provide your answer by inserting a text box and the answer must include: Null hypothesis, Alternative hypothesis, Show answer (output table/summary table), and Conclusion based on the P value. Showing the calculation is a must. If calculation is missing,so please provide a step by step on the answers Numerical answers in the yellow cellsarrow_forwardShow all workarrow_forward
arrow_back_ios
SEE MORE QUESTIONS
arrow_forward_ios
Recommended textbooks for you
 Glencoe Algebra 1, Student Edition, 9780079039897...AlgebraISBN:9780079039897Author:CarterPublisher:McGraw Hill
 College Algebra (MindTap Course List)AlgebraISBN:9781305652231Author:R. David Gustafson, Jeff HughesPublisher:Cengage Learning
Glencoe Algebra 1, Student Edition, 9780079039897...
Algebra
ISBN:9780079039897
Author:Carter
Publisher:McGraw Hill
College Algebra (MindTap Course List)
Algebra
ISBN:9781305652231
Author:R. David Gustafson, Jeff Hughes
Publisher:Cengage Learning
Statistics 4.1 Introduction to Inferential Statistics; Author: Dr. Jack L. Jackson II;https://www.youtube.com/watch?v=QLo4TEvBvK4;License: Standard YouTube License, CC-BY