Concept explainers
Videos
To analyze:
The ratio of Saturated acid to unsaturated fatty acid in the ethanolamine phospholipids of an animal, given that the fluorescence of membrane probe is 0.27.
Given:
Fluorescence of membrane probe is 0.27. The fluorescence of the membrane probes from different animals was recorded in Figure 1 as a graph. The graph represents the fluorescence with respect to a set of temperature ranging from 0°C to 37°C.
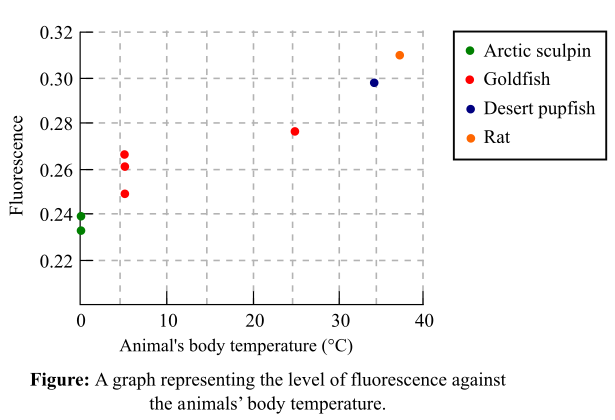
Figure 1: A graph representing the level of fluorescence against the animal’s body temperature.
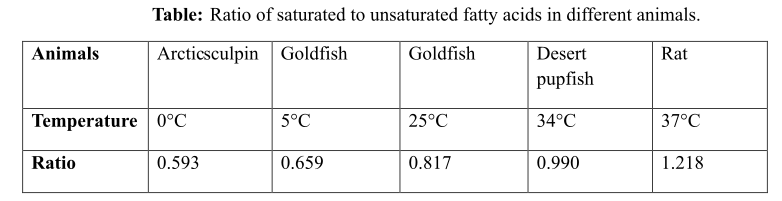
The ratio of saturated to unsaturated fatty acids in different animals, against a particular temperature is provided in the following Table 1 below:
Table 1: The ratio of saturated to unsaturated fatty acids in different animals
Introduction:
The saturated fatty acids are those that have single bonds in hydrocarbon chains, unlike the unsaturated fatty acids that have double or triple bonds in their hydrocarbon chains. The ethanolamine is a phospholipid that is generally present in the inner leaflet of the plasma membrane. The hydrocarbon chain of the ethanolamine phospholipid contains more concentration of unsaturated fatty acids when the temperature of the membrane is low. The ratio of saturated to unsaturated fatty acids is used by the researchers to find out the flexibility and the composition of the plasma membrane. The information also provides the range of the temperatures at which the organisms can operate their biological functions.
Want to see the full answer?
Check out a sample textbook solution
Chapter 6 Solutions
LIFE:SCIENCE OF BIOL.(LL) >CUSTOM<


- With reference to their absorption spectra of the oxy haemoglobin intact line) and deoxyhemoglobin (broken line) shown in Figure 2 below, how would you best explain the reason why there are differences in the major peaks of the spectra? Figure 2. SPECTRA OF OXYGENATED AND DEOXYGENATED HAEMOGLOBIN OBTAINED WITH THE RECORDING SPECTROPHOTOMETER 1.4 Abs < 0.8 06 0.4 400 420 440 460 480 500 520 540 560 580 600 nm 1. The difference in the spectra is due to a pH change in the deoxy-haemoglobin due to uptake of CO2- 2. There is more oxygen-carrying plasma in the oxy-haemoglobin sample. 3. The change in Mr due to oxygen binding causes the oxy haemoglobin to have a higher absorbance peak. 4. Oxy-haemoglobin is contaminated by carbaminohemoglobin, and therefore has a higher absorbance peak 5. Oxy-haemoglobin absorbs more light of blue wavelengths and less of red wavelengths than deoxy-haemoglobinarrow_forwardWhich ONE of the following is FALSE regarding haemoglobin? It has two alpha subunits and two beta subunits. The subunits are joined by disulphide bonds. Each subunit covalently binds a haem group. Conformational change in one subunit can be transmitted to another. There are many variant ("mutant") forms of haemoglobin that are not harmful.arrow_forwardWhich ONE of the following is FALSE regarding haemoglobin? It has two alpha subunits and two beta subunits. The subunits are joined by disulphide bonds. Each subunit covalently binds a haem group. Conformational change in one subunit can be transmitted to another. There are many variant ("mutant") forms of haemoglobin that are not harmful.arrow_forward
- During a routine medical check up of a healthy man it was found that his haematocrit value was highly unusual – value of 60%. What one of the options below is the most likely reason? He will have a diet high in iron. He is likely to be suffering from anaemia. He lives at high altitude. He has recently recovered from an accident where he lost a lot of blood. He has a very large body size.arrow_forwardExplain what age of culture is most likely to produce an endospore?arrow_forwardExplain why hot temperatures greater than 45 degrees celsius would not initiate the sporulation process in endospores?arrow_forward
- Endospore stain: Consider tube 2 of the 7-day bacillus culture. After is was heated, it was incubated for 24 hours then refrigerated. Do you think the cloudiness in this tube is due mostly to vegetative cells or to endospores? Explain your reasoningarrow_forwardReactunts C6H12O6 (Glucose) + 2NAD+ + 2ADP 2 Pyruvic acid + 2NADH + 2ATP a. Which of the above are the reactants? b. Which of the above are the products? c. Which reactant is the electron donor? GHz 06 (glucose) d. Which reactant is the electron acceptor? NAD e. Which of the products have been reduced? NADH f. Which of the products have been oxidized? g. Which process was used to produce the ATP? h. Where was the energy initially in this chemical reaction and where is it now that it is finished? i. Where was the carbon initially in this chemical reaction and where is it now that it is finished? j. Where were the electrons initially in this chemical reaction and where is it now that it is finished? 3arrow_forwardThere is ________ the concept of global warming. Very strong evidence to support Some strong evidence to support Evidence both supporting and against Evidence againstarrow_forward
- How many types of reactions can an enzyme perform?arrow_forwardYour goal is to produce black seeds resistant to mold. So you make the same cross again (between a homozygous black seeded, mold susceptible parent and a homozygous white seeded and mold resistant parent), and, again, advance progeny by SSD to create 100 F10 generation plants. Based on the information you obtained from your first crossing experiment (Question #4), how many F10 plants would you expect to have black seeds and be resistant to mold? Assume that a toxin produced by the mold fungus has been isolated. Only mold resistant seeds will germinate in the presence of the toxin. Could you use this toxin screening procedure to have segregation distortion work in your favor in the F2 generation? Explain your answer. Info from Question 4 a. P Locus (Seed Color): Hypothesis: The null hypothesis (H₀) is that seed color is controlled by alleles at a single locus. Observed Data: Total white seeds: 45 (resistant plants) + 6 (susceptible plants) = 51 Total black seeds: 7 (resistant…arrow_forward10. Consider the following enzyme and its substrate where the "+" and "-" indicate cations and anions, respectively. Explain which of the following inhibitors could inhibit this enzyme? Which type of inhibitor would it be and why? (Video 5-2) Substrate Enzyme Potential inhibitorsarrow_forward
 Biology: The Dynamic Science (MindTap Course List)BiologyISBN:9781305389892Author:Peter J. Russell, Paul E. Hertz, Beverly McMillanPublisher:Cengage Learning
 BiochemistryBiochemistryISBN:9781305577206Author:Reginald H. Garrett, Charles M. GrishamPublisher:Cengage Learning
 Biology 2eBiologyISBN:9781947172517Author:Matthew Douglas, Jung Choi, Mary Ann ClarkPublisher:OpenStax
 BiochemistryBiochemistryISBN:9781305961135Author:Mary K. Campbell, Shawn O. Farrell, Owen M. McDougalPublisher:Cengage Learning
 Human Physiology: From Cells to Systems (MindTap ...BiologyISBN:9781285866932Author:Lauralee SherwoodPublisher:Cengage Learning
 Human Heredity: Principles and Issues (MindTap Co...BiologyISBN:9781305251052Author:Michael CummingsPublisher:Cengage Learning