
Concept explainers
Videos
To analyze:
The inference that can be deciphered from the graph showing the relative fluidity of cell membranes in different species and whether the trend shown is apparent.
Given:
Researchers conducted an experiment to comparatively study the fluidity and composition of cell membranes. They maintained arctic sculpin at 0°C, a group of goldfish at 5°C, other group of goldfish at 25°C. They also maintained the desert pupfish at 34°C, and rats at normal temperature of 21°C. After keeping them for several days, the neuronal cells of all the animals were taken and membranes were isolated.
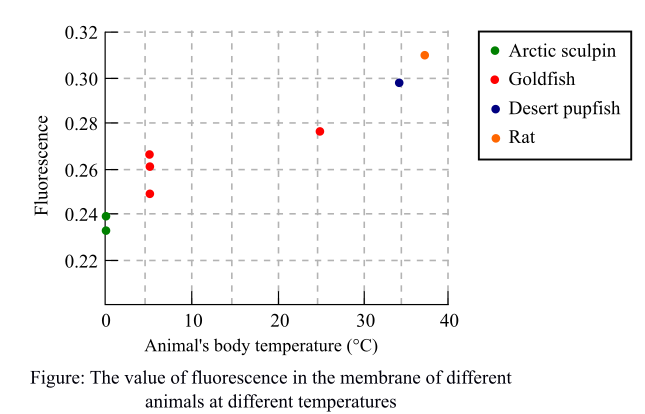
A fluorescent molecule was added to each of the extracted membranes and kept for some time at 20°C. Researchers then measured fluorescence and a graph was plotted by them. The graph depicted fluorescence against the body temperature of each of the animals.
The following graph shows the fluorescence of each animal depicted as colorful points at different temperatures. The more the value of fluorescence, the less will be the movement of molecules depicting a less fluid membrane.
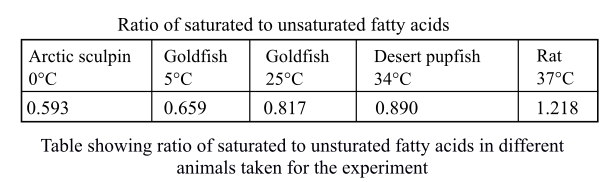
The following table was drawn by the researchers showing the ratio of saturated-to-unsaturated fatty acids in the phospholipid phosphatidyl choline for different animals taken into consideration.
Introduction:
The membrane is fluid in nature and is responsible for the transport of various molecules in and outside the cell. The fluidity of the membrane depends on the temperature and unsaturation. The low temperature leads to increase in fluidity to cope up the temperature. The saturated fatty acids are those fatty acids which do not have any double bond and have no scope of addition of any molecule. They can only substitute the molecules. The unsaturated fatty acids are those which have one or more double or triple bonds that increase the fluidity of the membrane. The species that survive in lower temperature have more amounts of unsaturated fatty acids so that they can avoid being frozen and remain fluid for transportation of the molecules.
Explanation of Solution
The data in the graph shows the value of fluorescence in different species at different temperature. It was observed that when the temperature of the animal’s body is low as in the case of arctic sculpin, the value of fluorescence is also low. There is an inverse relation between the movement of molecules and value of fluorescence. The low fluorescence depicts the high movement of molecules in the artic sculpin showing that the membrane has greater fluidity. The greater fluidity of the membrane helps these organisms to withstand such low temperature. In contrast, the fluidity of membranes of rats is low as the fluorescence value shown in the graph is high. This indicates that fluidity of membrane is not as high as in the species of low temperature.
The data of membrane fluidity depends on the temperature of the animal and is apparent as the fluidity of the membrane will change according to the change in the temperature.
Thus, it was concluded that the post translational modifications are important for the proper protein functioning and deoxyribonucleic acid (DNA) of the protein decides whether the modification should occur or not. The trend shown in the graph is apparent.
Want to see more full solutions like this?
Chapter 6 Solutions
LIFE:SCIENCE OF BIOL.(LL) >CUSTOM<


- Question 4 1 pts Which of the following would be most helpful for demonstrating alternative splicing for a new organism? ○ its proteome and its transcriptome only its transcriptome only its genome its proteome and its genomearrow_forwardIf the metabolic scenario stated with 100 mM of a sucrose solution, how much ATP would be made then during fermentation?arrow_forwardWhat is agricuarrow_forward
- When using the concept of "a calorie in is equal to a calorie out" how important is the quality of the calories?arrow_forwardWhat did the Cre-lox system used in the Kikuchi et al. 2010 heart regeneration experiment allow researchers to investigate? What was the purpose of the cmlc2 promoter? What is CreER and why was it used in this experiment? If constitutively active Cre was driven by the cmlc2 promoter, rather than an inducible CreER system, what color would you expect new cardiomyocytes in the regenerated area to be no matter what? Why?arrow_forwardWhat kind of organ size regulation is occurring when you graft multiple organs into a mouse and the graft weight stays the same?arrow_forward
- What is the concept "calories consumed must equal calories burned" in regrads to nutrition?arrow_forwardYou intend to insert patched dominant negative DNA into the left half of the neural tube of a chick. 1) Which side of the neural tube would you put the positive electrode to ensure that the DNA ends up on the left side? 2) What would be the internal (within the embryo) control for this experiment? 3) How can you be sure that the electroporation method itself is not impacting the embryo? 4) What would you do to ensure that the electroporation is working? How can you tell?arrow_forwardDescribe a method to document the diffusion path and gradient of Sonic Hedgehog through the chicken embryo. If modifying the protein, what is one thing you have to consider in regards to maintaining the protein’s function?arrow_forward
- The following table is from Kumar et. al. Highly Selective Dopamine D3 Receptor (DR) Antagonists and Partial Agonists Based on Eticlopride and the D3R Crystal Structure: New Leads for Opioid Dependence Treatment. J. Med Chem 2016.arrow_forwardThe following figure is from Caterina et al. The capsaicin receptor: a heat activated ion channel in the pain pathway. Nature, 1997. Black boxes indicate capsaicin, white circles indicate resinferatoxin. You are a chef in a fancy new science-themed restaurant. You have a recipe that calls for 1 teaspoon of resinferatoxin, but you feel uncomfortable serving foods with "toxins" in them. How much capsaicin could you substitute instead?arrow_forwardWhat protein is necessary for packaging acetylcholine into synaptic vesicles?arrow_forward
 Biology (MindTap Course List)BiologyISBN:9781337392938Author:Eldra Solomon, Charles Martin, Diana W. Martin, Linda R. BergPublisher:Cengage Learning
 Concepts of BiologyBiologyISBN:9781938168116Author:Samantha Fowler, Rebecca Roush, James WisePublisher:OpenStax College
 Principles Of Radiographic Imaging: An Art And A ...Health & NutritionISBN:9781337711067Author:Richard R. Carlton, Arlene M. Adler, Vesna BalacPublisher:Cengage Learning
 Human Biology (MindTap Course List)BiologyISBN:9781305112100Author:Cecie Starr, Beverly McMillanPublisher:Cengage Learning
 Human Physiology: From Cells to Systems (MindTap ...BiologyISBN:9781285866932Author:Lauralee SherwoodPublisher:Cengage Learning
 Biology 2eBiologyISBN:9781947172517Author:Matthew Douglas, Jung Choi, Mary Ann ClarkPublisher:OpenStax