
Introductory Statistics
1st Edition
ISBN: 9781938168208
Author: Barbara Illowsky, Susan Dean
Publisher: OpenStax College
expand_more
expand_more
format_list_bulleted
Concept explainers
Videos
Textbook Question
Chapter 6, Problem 46P
How would you represent the area to the left of three in a
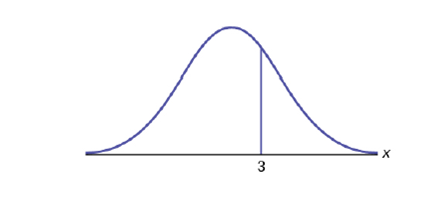
Figure 6.14
Expert Solution & Answer
Want to see the full answer?
Check out a sample textbook solution
Students have asked these similar questions
Test the claim that a student's pulse rate is different when taking a quiz than attending a regular class. The mean pulse rate difference is 2.7 with 10 students. Use a significance level of 0.005.
Pulse rate difference(Quiz - Lecture)
2
-1
5
-8
1
20
15
-4
9
-12
The following ordered data list shows the data speeds for cell phones used by a
telephone company at an airport:
A. Calculate the Measures of Central Tendency from the ungrouped data list.
B. Group the data in an appropriate frequency table.
C. Calculate the Measures of Central Tendency using the table in point B.
D. Are there differences in the measurements obtained in A and C? Why (give at
least one justified reason)?
I leave the answers to A and B to resolve the remaining two.
0.8
1.4
1.8
1.9
3.2
3.6
4.5
4.5
4.6
6.2
6.5
7.7
7.9
9.9
10.2
10.3
10.9
11.1
11.1
11.6
11.8
12.0
13.1
13.5
13.7
14.1
14.2
14.7
15.0
15.1
15.5
15.8
16.0
17.5
18.2
20.2
21.1
21.5
22.2
22.4
23.1
24.5
25.7
28.5
34.6
38.5
43.0
55.6
71.3
77.8
A. Measures of Central Tendency
We are to calculate:
Mean, Median, Mode
The data (already ordered) is:
0.8, 1.4, 1.8, 1.9, 3.2, 3.6, 4.5, 4.5, 4.6, 6.2, 6.5, 7.7, 7.9, 9.9, 10.2, 10.3, 10.9,
11.1, 11.1, 11.6,
11.8, 12.0, 13.1, 13.5, 13.7, 14.1, 14.2, 14.7, 15.0, 15.1, 15.5,…
PEER REPLY 1:
Choose a classmate's Main Post.
1. Indicate a range of values for the independent variable (x) that is reasonable
based on the data provided.
2. Explain what the predicted range of dependent values should be based on
the range of independent values.
Chapter 6 Solutions
Introductory Statistics
Ch. 6 - What is the z-score of x, when x = 1 and...Ch. 6 - Fill In the blanks. Jerome averages 16 points a...Ch. 6 - Use the Information in Example 6.3 to answer the...Ch. 6 - In 2012, 1,664,479 students took the SAT exam. The...Ch. 6 - Suppose X has a normal distribution with mean 25...Ch. 6 - The scores on a college entrance exam have an...Ch. 6 - If the area to the left of x is 0.012, then what...Ch. 6 - The golf scores for a school team were normally...Ch. 6 - The golf scores for a school team were normally...Ch. 6 - Use the Information in Example 6.10 to answer the...
Ch. 6 - Two thousand students took an exam. The scores on...Ch. 6 - Using the information from Example 6.12, answer...Ch. 6 - A bottle of water contains 12.05 fluid ounces with...Ch. 6 - A normal distribution has a mean of 61 and a...Ch. 6 - X~N(1,2)=Ch. 6 - A company manufactures rubber balls. The mean...Ch. 6 - X~N(-4, 1) What is the median?Ch. 6 - X~N(3,5)=Ch. 6 - X~N(2,1)=Ch. 6 - What does a z-score measure?Ch. 6 - What does standardizing a normal distribution do...Ch. 6 - Is X ~N(0, 1) a standardized normal distribution?...Ch. 6 - What is the z-score of x = 12, if it is two...Ch. 6 - What is the z-score of x = 9, if it is 1.5...Ch. 6 - What is the z-score of x = —2, if it is 2.78...Ch. 6 - What is the z-score of x = 7, if it is 0.133...Ch. 6 - Suppose X~ N(2, 6). What value of x has a z-score...Ch. 6 - Suppose X~ N(8, 1). ‘What value of x has a z-score...Ch. 6 - Suppose X ~N(9, 5). What value of x has a z-score...Ch. 6 - Suppose X~ N(2, 3). That value of x has a z-score...Ch. 6 - Suppose X ~N(4, 2). What value of x is 1.5...Ch. 6 - Suppose X ~N(4, 2). What value of x is two...Ch. 6 - Suppose X ~N(8, 9). What value of x is 0.67...Ch. 6 - Suppose X ~N(—1, 2). What is the z-score of x = 2?Ch. 6 - Suppose X ~N( 12, 6). What is the z-score of x =...Ch. 6 - Suppose X ~N(9, 3). What is the z-score of x = 9?Ch. 6 - Suppose a normal distribution has a mean of six...Ch. 6 - In a normal distribution, x = 5 and z = —1.25....Ch. 6 - In a normal distribution, x = 3 and z = 0.67. This...Ch. 6 - In a normal distribution, x = —2 and z = 6. This...Ch. 6 - In a normal distribution, x = —5 and z = —3.14....Ch. 6 - In a normal distribution, x= 6 and z —1.7. This...Ch. 6 - About what percent of x values from a normal...Ch. 6 - About what percent of the x values from a normal...Ch. 6 - About what percent of x values lie between the...Ch. 6 - Suppose X N( 15, 3). Between what x values does...Ch. 6 - Suppose X~ N(—3, 1). Between what x values does...Ch. 6 - Suppose X ~N(—3, 1). Between what x values does...Ch. 6 - About what percent of x values lie between the...Ch. 6 - About what percent of x values lie between the...Ch. 6 - About what percent of x values lie between the...Ch. 6 - About what percent of x values lie between the...Ch. 6 - Use the following information to answer the next t...Ch. 6 - Use the following information to answer the next t...Ch. 6 - How would you represent the area to the left of...Ch. 6 - What is the area to the right of one? Figure 6.13Ch. 6 - Is P(x < 1) equal to P(x1) ? ‘by?Ch. 6 - How would you represent the area to the left of...Ch. 6 - What is the area to the right of three? Figure...Ch. 6 - If the area to the left of x in a normal...Ch. 6 - If the area to the tight of x in a normal...Ch. 6 - Use the following information to answer the next...Ch. 6 - Use the following information to answer the next...Ch. 6 - Use the following information to answer the next...Ch. 6 - Use the following information to answer the next...Ch. 6 - X~N(6, 2) Find the probability that x is between...Ch. 6 - X~N(—3, 4) Find the probability that x is between...Ch. 6 - X~N(4,5) Find the maxium of x in the bottom...Ch. 6 - Use the following information to answer the next...Ch. 6 - Find the probability that a CD player will last...Ch. 6 - Find the 70th percentile of the distribution for...Ch. 6 - Use the following information to answer the next r...Ch. 6 - Use the following information to answer the next r...Ch. 6 - The length of time to find it takes to find a...Ch. 6 - The heights of the 430 National Basketball...Ch. 6 - The systolic blood pressure (given In millimeters)...Ch. 6 - Kyle’s doctor told him that the z-score for his...Ch. 6 - Height and weight are two measurements used to...Ch. 6 - In 2005, 1,475,623 students heading to college...Ch. 6 - Use the following information (0 answer the next...Ch. 6 - Use the following information (0 answer the next...Ch. 6 - Use the following information to answer the next...Ch. 6 - Use the following information to answer the next...Ch. 6 - Use the following information to answer the next...Ch. 6 - According to a study done by De Anza students, the...Ch. 6 - IQ is normally distributed with a mean of 100 and...Ch. 6 - The percent of fat calories that a person In...Ch. 6 - Suppose that the distance of fly balls hit to the...Ch. 6 - In China, four-ear-olds average three bows a day...Ch. 6 - In the 1992 presidential election, Alaska's 40...Ch. 6 - Suppose that the duration of a particular type of...Ch. 6 - Tern Vogel, an amateur motorcycle racer, averages...Ch. 6 - Thuy Dau, Ngoc Bui, Sam Su, and Lan Voung...Ch. 6 - Suppose that Ricardo and Anita attend different...Ch. 6 - Table 6.4 shows a sample of the maximum capacity...Ch. 6 - An expert witness for a paternity lawsuit...Ch. 6 - A NUMMI assembly Line, which has been operating...Ch. 6 - We flip a coin 100 times (n = 100) and note that...Ch. 6 - A $1 scratch off lotto ticket will be a inner one...Ch. 6 - Facebook provides a variety of statistics on its...
Additional Math Textbook Solutions
Find more solutions based on key concepts
CHECK POINT 1 Write a word description of the set L = {a, b, c, d, e, f}.
Thinking Mathematically (6th Edition)
Motion in the Plane
In Exercises 5–8, r(t) is the position of a particle in the xy-plane at time t. Find an equ...
University Calculus: Early Transcendentals (4th Edition)
Testing Claims About Proportions. In Exercises 7–22, test the given claim. Identify the null hypothesis, altern...
Elementary Statistics (13th Edition)
TRY IT YOURSELF 1
Find the mean of the points scored by the 51 winning teams listed on page 39.
Elementary Statistics: Picturing the World (7th Edition)
Knowledge Booster


Learn more about
Need a deep-dive on the concept behind this application? Look no further. Learn more about this topic, statistics and related others by exploring similar questions and additional content below.Similar questions
- In a company with 80 employees, 60 earn $10.00 per hour and 20 earn $13.00 per hour. Is this average hourly wage considered representative?arrow_forwardThe following is a list of questions answered correctly on an exam. Calculate the Measures of Central Tendency from the ungrouped data list. NUMBER OF QUESTIONS ANSWERED CORRECTLY ON AN APTITUDE EXAM 112 72 69 97 107 73 92 76 86 73 126 128 118 127 124 82 104 132 134 83 92 108 96 100 92 115 76 91 102 81 95 141 81 80 106 84 119 113 98 75 68 98 115 106 95 100 85 94 106 119arrow_forwardThe following ordered data list shows the data speeds for cell phones used by a telephone company at an airport: A. Calculate the Measures of Central Tendency using the table in point B. B. Are there differences in the measurements obtained in A and C? Why (give at least one justified reason)? 0.8 1.4 1.8 1.9 3.2 3.6 4.5 4.5 4.6 6.2 6.5 7.7 7.9 9.9 10.2 10.3 10.9 11.1 11.1 11.6 11.8 12.0 13.1 13.5 13.7 14.1 14.2 14.7 15.0 15.1 15.5 15.8 16.0 17.5 18.2 20.2 21.1 21.5 22.2 22.4 23.1 24.5 25.7 28.5 34.6 38.5 43.0 55.6 71.3 77.8arrow_forward
- In a company with 80 employees, 60 earn $10.00 per hour and 20 earn $13.00 per hour. a) Determine the average hourly wage. b) In part a), is the same answer obtained if the 60 employees have an average wage of $10.00 per hour? Prove your answer.arrow_forwardThe following ordered data list shows the data speeds for cell phones used by a telephone company at an airport: A. Calculate the Measures of Central Tendency from the ungrouped data list. B. Group the data in an appropriate frequency table. 0.8 1.4 1.8 1.9 3.2 3.6 4.5 4.5 4.6 6.2 6.5 7.7 7.9 9.9 10.2 10.3 10.9 11.1 11.1 11.6 11.8 12.0 13.1 13.5 13.7 14.1 14.2 14.7 15.0 15.1 15.5 15.8 16.0 17.5 18.2 20.2 21.1 21.5 22.2 22.4 23.1 24.5 25.7 28.5 34.6 38.5 43.0 55.6 71.3 77.8arrow_forwardBusinessarrow_forward
- https://www.hawkeslearning.com/Statistics/dbs2/datasets.htmlarrow_forwardNC Current Students - North Ce X | NC Canvas Login Links - North ( X Final Exam Comprehensive x Cengage Learning x WASTAT - Final Exam - STAT → C webassign.net/web/Student/Assignment-Responses/submit?dep=36055360&tags=autosave#question3659890_9 Part (b) Draw a scatter plot of the ordered pairs. N Life Expectancy Life Expectancy 80 70 600 50 40 30 20 10 Year of 1950 1970 1990 2010 Birth O Life Expectancy Part (c) 800 70 60 50 40 30 20 10 1950 1970 1990 W ALT 林 $ # 4 R J7 Year of 2010 Birth F6 4+ 80 70 60 50 40 30 20 10 Year of 1950 1970 1990 2010 Birth Life Expectancy Ox 800 70 60 50 40 30 20 10 Year of 1950 1970 1990 2010 Birth hp P.B. KA & 7 80 % 5 H A B F10 711 N M K 744 PRT SC ALT CTRLarrow_forwardHarvard University California Institute of Technology Massachusetts Institute of Technology Stanford University Princeton University University of Cambridge University of Oxford University of California, Berkeley Imperial College London Yale University University of California, Los Angeles University of Chicago Johns Hopkins University Cornell University ETH Zurich University of Michigan University of Toronto Columbia University University of Pennsylvania Carnegie Mellon University University of Hong Kong University College London University of Washington Duke University Northwestern University University of Tokyo Georgia Institute of Technology Pohang University of Science and Technology University of California, Santa Barbara University of British Columbia University of North Carolina at Chapel Hill University of California, San Diego University of Illinois at Urbana-Champaign National University of Singapore McGill…arrow_forward
- Name Harvard University California Institute of Technology Massachusetts Institute of Technology Stanford University Princeton University University of Cambridge University of Oxford University of California, Berkeley Imperial College London Yale University University of California, Los Angeles University of Chicago Johns Hopkins University Cornell University ETH Zurich University of Michigan University of Toronto Columbia University University of Pennsylvania Carnegie Mellon University University of Hong Kong University College London University of Washington Duke University Northwestern University University of Tokyo Georgia Institute of Technology Pohang University of Science and Technology University of California, Santa Barbara University of British Columbia University of North Carolina at Chapel Hill University of California, San Diego University of Illinois at Urbana-Champaign National University of Singapore…arrow_forwardA company found that the daily sales revenue of its flagship product follows a normal distribution with a mean of $4500 and a standard deviation of $450. The company defines a "high-sales day" that is, any day with sales exceeding $4800. please provide a step by step on how to get the answers in excel Q: What percentage of days can the company expect to have "high-sales days" or sales greater than $4800? Q: What is the sales revenue threshold for the bottom 10% of days? (please note that 10% refers to the probability/area under bell curve towards the lower tail of bell curve) Provide answers in the yellow cellsarrow_forwardFind the critical value for a left-tailed test using the F distribution with a 0.025, degrees of freedom in the numerator=12, and degrees of freedom in the denominator = 50. A portion of the table of critical values of the F-distribution is provided. Click the icon to view the partial table of critical values of the F-distribution. What is the critical value? (Round to two decimal places as needed.)arrow_forward
arrow_back_ios
SEE MORE QUESTIONS
arrow_forward_ios
Recommended textbooks for you
 Holt Mcdougal Larson Pre-algebra: Student Edition...AlgebraISBN:9780547587776Author:HOLT MCDOUGALPublisher:HOLT MCDOUGAL
 College Algebra (MindTap Course List)AlgebraISBN:9781305652231Author:R. David Gustafson, Jeff HughesPublisher:Cengage Learning
 College AlgebraAlgebraISBN:9781305115545Author:James Stewart, Lothar Redlin, Saleem WatsonPublisher:Cengage Learning
 Glencoe Algebra 1, Student Edition, 9780079039897...AlgebraISBN:9780079039897Author:CarterPublisher:McGraw Hill
Holt Mcdougal Larson Pre-algebra: Student Edition...
Algebra
ISBN:9780547587776
Author:HOLT MCDOUGAL
Publisher:HOLT MCDOUGAL
College Algebra (MindTap Course List)
Algebra
ISBN:9781305652231
Author:R. David Gustafson, Jeff Hughes
Publisher:Cengage Learning
College Algebra
Algebra
ISBN:9781305115545
Author:James Stewart, Lothar Redlin, Saleem Watson
Publisher:Cengage Learning
Glencoe Algebra 1, Student Edition, 9780079039897...
Algebra
ISBN:9780079039897
Author:Carter
Publisher:McGraw Hill
Bayes' Theorem 1: Introduction and conditional probability; Author: Dr Nic's Maths and Stats;https://www.youtube.com/watch?v=lQVkXfJ-rpU;License: Standard YouTube License, CC-BY
What is Conditional Probability | Bayes Theorem | Conditional Probability Examples & Problems; Author: ACADGILD;https://www.youtube.com/watch?v=MxOny_1y2Q4;License: Standard YouTube License, CC-BY
Bayes' Theorem of Probability With Tree Diagrams & Venn Diagrams; Author: The Organic Chemistry Tutor;https://www.youtube.com/watch?v=OByl4RJxnKA;License: Standard YouTube License, CC-BY
Bayes' Theorem - The Simplest Case; Author: Dr. Trefor Bazett;https://www.youtube.com/watch?v=XQoLVl31ZfQ;License: Standard Youtube License