
Introductory Statistics
1st Edition
ISBN: 9781938168208
Author: Barbara Illowsky, Susan Dean
Publisher: OpenStax College
expand_more
expand_more
format_list_bulleted
Concept explainers
Videos
Textbook Question
Chapter 6, Problem 43P
How would you represent the area to the left of one in a
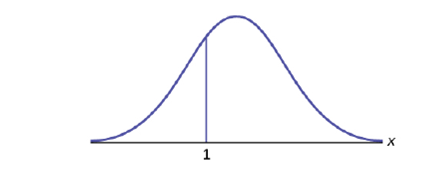
Figure 6.12
Expert Solution & Answer
Want to see the full answer?
Check out a sample textbook solution
Students have asked these similar questions
For each of the time series, construct a line chart of the data and identify the characteristics of the time series (that is, random, stationary, trend, seasonal, or cyclical).
Month PercentApr 1972 4.97May 1972 5.00Jun 1972 5.04Jul 1972 5.25Aug 1972 5.27Sep 1972 5.50Oct 1972 5.73Nov 1972 5.75Dec 1972 5.79Jan 1973 6.00Feb 1973 6.02Mar 1973 6.30Apr 1973 6.61May 1973 7.01Jun 1973 7.49Jul 1973 8.30Aug 1973 9.23Sep 1973 9.86Oct 1973 9.94Nov 1973 9.75Dec 1973 9.75Jan 1974 9.73Feb 1974 9.21Mar 1974 8.85Apr 1974 10.02May 1974 11.25Jun 1974 11.54Jul 1974 11.97Aug 1974 12.00Sep 1974 12.00Oct 1974 11.68Nov 1974 10.83Dec 1974 10.50Jan 1975 10.05Feb 1975 8.96Mar 1975 7.93Apr 1975 7.50May 1975 7.40Jun 1975 7.07Jul 1975 7.15Aug 1975 7.66Sep 1975 7.88Oct 1975 7.96Nov 1975 7.53Dec 1975 7.26Jan 1976 7.00Feb 1976 6.75Mar 1976 6.75Apr 1976 6.75May 1976…
Hi, I need to make sure I have drafted a thorough analysis, so please answer the following questions. Based on the data in the attached image, develop a regression model to forecast the average sales of football magazines for each of the seven home games in the upcoming season (Year 10). That is, you should construct a single regression model and use it to estimate the average demand for the seven home games in Year 10. In addition to the variables provided, you may create new variables based on these variables or based on observations of your analysis. Be sure to provide a thorough analysis of your final model (residual diagnostics) and provide assessments of its accuracy. What insights are available based on your regression model?
I want to make sure that I included all possible variables and observations. There is a considerable amount of data in the images below, but not all of it may be useful for your purposes. Are there variables contained in the file that you would exclude from a forecast model to determine football magazine sales in Year 10? If so, why? Are there particular observations of football magazine sales from previous years that you would exclude from your forecasting model? If so, why?
Chapter 6 Solutions
Introductory Statistics
Ch. 6 - What is the z-score of x, when x = 1 and...Ch. 6 - Fill In the blanks. Jerome averages 16 points a...Ch. 6 - Use the Information in Example 6.3 to answer the...Ch. 6 - In 2012, 1,664,479 students took the SAT exam. The...Ch. 6 - Suppose X has a normal distribution with mean 25...Ch. 6 - The scores on a college entrance exam have an...Ch. 6 - If the area to the left of x is 0.012, then what...Ch. 6 - The golf scores for a school team were normally...Ch. 6 - The golf scores for a school team were normally...Ch. 6 - Use the Information in Example 6.10 to answer the...
Ch. 6 - Two thousand students took an exam. The scores on...Ch. 6 - Using the information from Example 6.12, answer...Ch. 6 - A bottle of water contains 12.05 fluid ounces with...Ch. 6 - A normal distribution has a mean of 61 and a...Ch. 6 - X~N(1,2)=Ch. 6 - A company manufactures rubber balls. The mean...Ch. 6 - X~N(-4, 1) What is the median?Ch. 6 - X~N(3,5)=Ch. 6 - X~N(2,1)=Ch. 6 - What does a z-score measure?Ch. 6 - What does standardizing a normal distribution do...Ch. 6 - Is X ~N(0, 1) a standardized normal distribution?...Ch. 6 - What is the z-score of x = 12, if it is two...Ch. 6 - What is the z-score of x = 9, if it is 1.5...Ch. 6 - What is the z-score of x = —2, if it is 2.78...Ch. 6 - What is the z-score of x = 7, if it is 0.133...Ch. 6 - Suppose X~ N(2, 6). What value of x has a z-score...Ch. 6 - Suppose X~ N(8, 1). ‘What value of x has a z-score...Ch. 6 - Suppose X ~N(9, 5). What value of x has a z-score...Ch. 6 - Suppose X~ N(2, 3). That value of x has a z-score...Ch. 6 - Suppose X ~N(4, 2). What value of x is 1.5...Ch. 6 - Suppose X ~N(4, 2). What value of x is two...Ch. 6 - Suppose X ~N(8, 9). What value of x is 0.67...Ch. 6 - Suppose X ~N(—1, 2). What is the z-score of x = 2?Ch. 6 - Suppose X ~N( 12, 6). What is the z-score of x =...Ch. 6 - Suppose X ~N(9, 3). What is the z-score of x = 9?Ch. 6 - Suppose a normal distribution has a mean of six...Ch. 6 - In a normal distribution, x = 5 and z = —1.25....Ch. 6 - In a normal distribution, x = 3 and z = 0.67. This...Ch. 6 - In a normal distribution, x = —2 and z = 6. This...Ch. 6 - In a normal distribution, x = —5 and z = —3.14....Ch. 6 - In a normal distribution, x= 6 and z —1.7. This...Ch. 6 - About what percent of x values from a normal...Ch. 6 - About what percent of the x values from a normal...Ch. 6 - About what percent of x values lie between the...Ch. 6 - Suppose X N( 15, 3). Between what x values does...Ch. 6 - Suppose X~ N(—3, 1). Between what x values does...Ch. 6 - Suppose X ~N(—3, 1). Between what x values does...Ch. 6 - About what percent of x values lie between the...Ch. 6 - About what percent of x values lie between the...Ch. 6 - About what percent of x values lie between the...Ch. 6 - About what percent of x values lie between the...Ch. 6 - Use the following information to answer the next t...Ch. 6 - Use the following information to answer the next t...Ch. 6 - How would you represent the area to the left of...Ch. 6 - What is the area to the right of one? Figure 6.13Ch. 6 - Is P(x < 1) equal to P(x1) ? ‘by?Ch. 6 - How would you represent the area to the left of...Ch. 6 - What is the area to the right of three? Figure...Ch. 6 - If the area to the left of x in a normal...Ch. 6 - If the area to the tight of x in a normal...Ch. 6 - Use the following information to answer the next...Ch. 6 - Use the following information to answer the next...Ch. 6 - Use the following information to answer the next...Ch. 6 - Use the following information to answer the next...Ch. 6 - X~N(6, 2) Find the probability that x is between...Ch. 6 - X~N(—3, 4) Find the probability that x is between...Ch. 6 - X~N(4,5) Find the maxium of x in the bottom...Ch. 6 - Use the following information to answer the next...Ch. 6 - Find the probability that a CD player will last...Ch. 6 - Find the 70th percentile of the distribution for...Ch. 6 - Use the following information to answer the next r...Ch. 6 - Use the following information to answer the next r...Ch. 6 - The length of time to find it takes to find a...Ch. 6 - The heights of the 430 National Basketball...Ch. 6 - The systolic blood pressure (given In millimeters)...Ch. 6 - Kyle’s doctor told him that the z-score for his...Ch. 6 - Height and weight are two measurements used to...Ch. 6 - In 2005, 1,475,623 students heading to college...Ch. 6 - Use the following information (0 answer the next...Ch. 6 - Use the following information (0 answer the next...Ch. 6 - Use the following information to answer the next...Ch. 6 - Use the following information to answer the next...Ch. 6 - Use the following information to answer the next...Ch. 6 - According to a study done by De Anza students, the...Ch. 6 - IQ is normally distributed with a mean of 100 and...Ch. 6 - The percent of fat calories that a person In...Ch. 6 - Suppose that the distance of fly balls hit to the...Ch. 6 - In China, four-ear-olds average three bows a day...Ch. 6 - In the 1992 presidential election, Alaska's 40...Ch. 6 - Suppose that the duration of a particular type of...Ch. 6 - Tern Vogel, an amateur motorcycle racer, averages...Ch. 6 - Thuy Dau, Ngoc Bui, Sam Su, and Lan Voung...Ch. 6 - Suppose that Ricardo and Anita attend different...Ch. 6 - Table 6.4 shows a sample of the maximum capacity...Ch. 6 - An expert witness for a paternity lawsuit...Ch. 6 - A NUMMI assembly Line, which has been operating...Ch. 6 - We flip a coin 100 times (n = 100) and note that...Ch. 6 - A $1 scratch off lotto ticket will be a inner one...Ch. 6 - Facebook provides a variety of statistics on its...
Additional Math Textbook Solutions
Find more solutions based on key concepts
Standard Normal Distribution. In Exercises 17–36, assume that a randomly selected subject is given a bone densi...
Elementary Statistics (13th Edition)
Suppose you toss one coin three times in a row and get heads, tails, heads (HTH). If you are interested in the ...
Using and Understanding Mathematics: A Quantitative Reasoning Approach (6th Edition)
In Exercises 1-14. evaluate the iterated integral.
11.
University Calculus: Early Transcendentals (4th Edition)
Twenty five people, consisting of 15 women and 10 men are lined up in a random order. Find the probability that...
A First Course in Probability (10th Edition)
CHECK POINT I Let p and q represent the following statements: p : 3 + 5 = 8 q : 2 × 7 = 20. Determine the truth...
Thinking Mathematically (6th Edition)
Knowledge Booster


Learn more about
Need a deep-dive on the concept behind this application? Look no further. Learn more about this topic, statistics and related others by exploring similar questions and additional content below.Similar questions
- Stat questionsarrow_forward1) and let Xt is stochastic process with WSS and Rxlt t+t) 1) E (X5) = \ 1 2 Show that E (X5 = X 3 = 2 (= = =) Since X is WSSEL 2 3) find E(X5+ X3)² 4) sind E(X5+X2) J=1 ***arrow_forwardProve that 1) | RxX (T) | << = (R₁ " + R$) 2) find Laplalse trans. of Normal dis: 3) Prove thy t /Rx (z) | < | Rx (0)\ 4) show that evary algebra is algebra or not.arrow_forward
- For each of the time series, construct a line chart of the data and identify the characteristics of the time series (that is, random, stationary, trend, seasonal, or cyclical). Month Number (Thousands)Dec 1991 65.60Jan 1992 71.60Feb 1992 78.80Mar 1992 111.60Apr 1992 107.60May 1992 115.20Jun 1992 117.80Jul 1992 106.20Aug 1992 109.90Sep 1992 106.00Oct 1992 111.80Nov 1992 84.50Dec 1992 78.60Jan 1993 70.50Feb 1993 74.60Mar 1993 95.50Apr 1993 117.80May 1993 120.90Jun 1993 128.50Jul 1993 115.30Aug 1993 121.80Sep 1993 118.50Oct 1993 123.30Nov 1993 102.30Dec 1993 98.70Jan 1994 76.20Feb 1994 83.50Mar 1994 134.30Apr 1994 137.60May 1994 148.80Jun 1994 136.40Jul 1994 127.80Aug 1994 139.80Sep 1994 130.10Oct 1994 130.60Nov 1994 113.40Dec 1994 98.50Jan 1995 84.50Feb 1995 81.60Mar 1995 103.80Apr 1995 116.90May 1995 130.50Jun 1995 123.40Jul 1995 129.10Aug 1995…arrow_forwardFor each of the time series, construct a line chart of the data and identify the characteristics of the time series (that is, random, stationary, trend, seasonal, or cyclical). Year Month Units1 Nov 42,1611 Dec 44,1862 Jan 42,2272 Feb 45,4222 Mar 54,0752 Apr 50,9262 May 53,5722 Jun 54,9202 Jul 54,4492 Aug 56,0792 Sep 52,1772 Oct 50,0872 Nov 48,5132 Dec 49,2783 Jan 48,1343 Feb 54,8873 Mar 61,0643 Apr 53,3503 May 59,4673 Jun 59,3703 Jul 55,0883 Aug 59,3493 Sep 54,4723 Oct 53,164arrow_forwardHigh Cholesterol: A group of eight individuals with high cholesterol levels were given a new drug that was designed to lower cholesterol levels. Cholesterol levels, in milligrams per deciliter, were measured before and after treatment for each individual, with the following results: Individual Before 1 2 3 4 5 6 7 8 237 282 278 297 243 228 298 269 After 200 208 178 212 174 201 189 185 Part: 0/2 Part 1 of 2 (a) Construct a 99.9% confidence interval for the mean reduction in cholesterol level. Let a represent the cholesterol level before treatment minus the cholesterol level after. Use tables to find the critical value and round the answers to at least one decimal place.arrow_forward
- I worked out the answers for most of this, and provided the answers in the tables that follow. But for the total cost table, I need help working out the values for 10%, 11%, and 12%. A pharmaceutical company produces the drug NasaMist from four chemicals. Today, the company must produce 1000 pounds of the drug. The three active ingredients in NasaMist are A, B, and C. By weight, at least 8% of NasaMist must consist of A, at least 4% of B, and at least 2% of C. The cost per pound of each chemical and the amount of each active ingredient in one pound of each chemical are given in the data at the bottom. It is necessary that at least 100 pounds of chemical 2 and at least 450 pounds of chemical 3 be used. a. Determine the cheapest way of producing today’s batch of NasaMist. If needed, round your answers to one decimal digit. Production plan Weight (lbs) Chemical 1 257.1 Chemical 2 100 Chemical 3 450 Chemical 4 192.9 b. Use SolverTable to see how much the percentage of…arrow_forwardAt the beginning of year 1, you have $10,000. Investments A and B are available; their cash flows per dollars invested are shown in the table below. Assume that any money not invested in A or B earns interest at an annual rate of 2%. a. What is the maximized amount of cash on hand at the beginning of year 4.$ ___________ A B Time 0 -$1.00 $0.00 Time 1 $0.20 -$1.00 Time 2 $1.50 $0.00 Time 3 $0.00 $1.90arrow_forwardFor each of the time series, construct a line chart of the data and identify the characteristics of the time series (that is, random, stationary, trend, seasonal, or cyclical). Year Month Rate (%)2009 Mar 8.72009 Apr 9.02009 May 9.42009 Jun 9.52009 Jul 9.52009 Aug 9.62009 Sep 9.82009 Oct 10.02009 Nov 9.92009 Dec 9.92010 Jan 9.82010 Feb 9.82010 Mar 9.92010 Apr 9.92010 May 9.62010 Jun 9.42010 Jul 9.52010 Aug 9.52010 Sep 9.52010 Oct 9.52010 Nov 9.82010 Dec 9.32011 Jan 9.12011 Feb 9.02011 Mar 8.92011 Apr 9.02011 May 9.02011 Jun 9.12011 Jul 9.02011 Aug 9.02011 Sep 9.02011 Oct 8.92011 Nov 8.62011 Dec 8.52012 Jan 8.32012 Feb 8.32012 Mar 8.22012 Apr 8.12012 May 8.22012 Jun 8.22012 Jul 8.22012 Aug 8.12012 Sep 7.82012 Oct…arrow_forward
- For each of the time series, construct a line chart of the data and identify the characteristics of the time series (that is, random, stationary, trend, seasonal, or cyclical). Date IBM9/7/2010 $125.959/8/2010 $126.089/9/2010 $126.369/10/2010 $127.999/13/2010 $129.619/14/2010 $128.859/15/2010 $129.439/16/2010 $129.679/17/2010 $130.199/20/2010 $131.79 a. Construct a line chart of the closing stock prices data. Choose the correct chart below.arrow_forwardFor each of the time series, construct a line chart of the data and identify the characteristics of the time series (that is, random, stationary, trend, seasonal, or cyclical) Date IBM9/7/2010 $125.959/8/2010 $126.089/9/2010 $126.369/10/2010 $127.999/13/2010 $129.619/14/2010 $128.859/15/2010 $129.439/16/2010 $129.679/17/2010 $130.199/20/2010 $131.79arrow_forward1. A consumer group claims that the mean annual consumption of cheddar cheese by a person in the United States is at most 10.3 pounds. A random sample of 100 people in the United States has a mean annual cheddar cheese consumption of 9.9 pounds. Assume the population standard deviation is 2.1 pounds. At a = 0.05, can you reject the claim? (Adapted from U.S. Department of Agriculture) State the hypotheses: Calculate the test statistic: Calculate the P-value: Conclusion (reject or fail to reject Ho): 2. The CEO of a manufacturing facility claims that the mean workday of the company's assembly line employees is less than 8.5 hours. A random sample of 25 of the company's assembly line employees has a mean workday of 8.2 hours. Assume the population standard deviation is 0.5 hour and the population is normally distributed. At a = 0.01, test the CEO's claim. State the hypotheses: Calculate the test statistic: Calculate the P-value: Conclusion (reject or fail to reject Ho): Statisticsarrow_forward
arrow_back_ios
SEE MORE QUESTIONS
arrow_forward_ios
Recommended textbooks for you
 Holt Mcdougal Larson Pre-algebra: Student Edition...AlgebraISBN:9780547587776Author:HOLT MCDOUGALPublisher:HOLT MCDOUGAL
 College Algebra (MindTap Course List)AlgebraISBN:9781305652231Author:R. David Gustafson, Jeff HughesPublisher:Cengage Learning
 College AlgebraAlgebraISBN:9781305115545Author:James Stewart, Lothar Redlin, Saleem WatsonPublisher:Cengage Learning
Holt Mcdougal Larson Pre-algebra: Student Edition...
Algebra
ISBN:9780547587776
Author:HOLT MCDOUGAL
Publisher:HOLT MCDOUGAL
College Algebra (MindTap Course List)
Algebra
ISBN:9781305652231
Author:R. David Gustafson, Jeff Hughes
Publisher:Cengage Learning
College Algebra
Algebra
ISBN:9781305115545
Author:James Stewart, Lothar Redlin, Saleem Watson
Publisher:Cengage Learning
Bayes' Theorem 1: Introduction and conditional probability; Author: Dr Nic's Maths and Stats;https://www.youtube.com/watch?v=lQVkXfJ-rpU;License: Standard YouTube License, CC-BY
What is Conditional Probability | Bayes Theorem | Conditional Probability Examples & Problems; Author: ACADGILD;https://www.youtube.com/watch?v=MxOny_1y2Q4;License: Standard YouTube License, CC-BY
Bayes' Theorem of Probability With Tree Diagrams & Venn Diagrams; Author: The Organic Chemistry Tutor;https://www.youtube.com/watch?v=OByl4RJxnKA;License: Standard YouTube License, CC-BY
Bayes' Theorem - The Simplest Case; Author: Dr. Trefor Bazett;https://www.youtube.com/watch?v=XQoLVl31ZfQ;License: Standard Youtube License