
Essentials of Business Analytics (MindTap Course List)
2nd Edition
ISBN: 9781305627734
Author: Jeffrey D. Camm, James J. Cochran, Michael J. Fry, Jeffrey W. Ohlmann, David R. Anderson
Publisher: Cengage Learning
expand_more
expand_more
format_list_bulleted
Concept explainers
Videos
Textbook Question
Chapter 6, Problem 1P
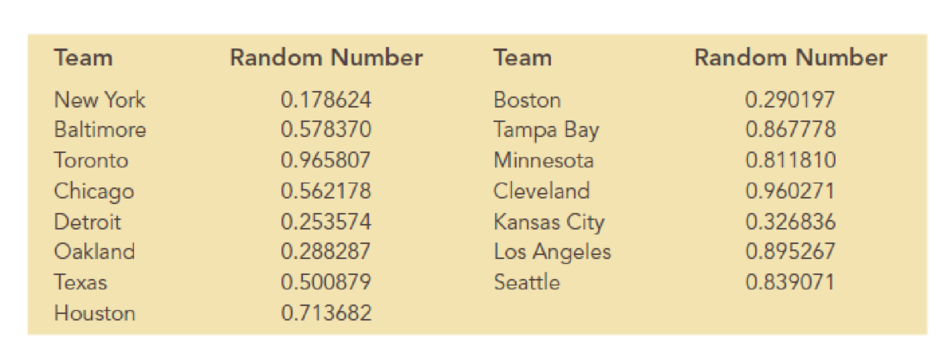
The American League consists of 15 baseball teams. Suppose a sample of 5 teams is to be selected to conduct player interviews. The following table lists the 15 teams and the random numbers assigned by Excel’s RAND
Expert Solution & Answer
To determine
Select a random sample size 5.
Answer to Problem 1P
The simple random sample consists of Team Ne, Team De, Team Oa, Team Bo, and Team Ka.
Explanation of Solution
The ascending order of random number is given below:
| Team | Random Number |
| Ne | 0.178624 |
| De | 0.253574 |
| Oa | 0.288287 |
| Bo | 0.290197 |
| Ka | 0.326836 |
| Te | 0.500879 |
| Ch | 0.562178 |
| Ba | 0.57837 |
| Ho | 0.713682 |
| Mi | 0.81181 |
| Se | 0.839071 |
| Ta | 0.867778 |
| Lo | 0.895267 |
| To | 0.965807 |
The simple random sample consists of least 5 random numbers.
Therefore, the simple random sample of size 5 is Team Ne, Team De, Team Oa, Team Bo, and Team Ka
Want to see more full solutions like this?
Subscribe now to access step-by-step solutions to millions of textbook problems written by subject matter experts!
Students have asked these similar questions
Example 4 (Part 1) One of the datasets in the Lock book
contains information about 215 countries of the world. One
of the variables is the percentage of people in the country
who have access to the internet. We have data for 203 of
those countries. The plot on the right shows a dotplot of
the data.
1. What are the cases?
Population
n = 203, mean = 43.024
median = 43.5, stdev = 29.259
20
2. What does each dot on the dotplot represent?
15
10
5
20
40
43.024
60
80
3. What type of data is do we collect from the cases, quantitative or categorical?
Let x be a random variable that represents the percentage of successful free throws a professional basketball player makes in a season. Let y be a random variable that represents the percentage of successful field goals a professional basketball player makes in a season. A random sample of n =6 professional basketball players gave the following information.
x
63
79
70
80
84
87
y
46
49
45
55
57
58
Find Se. Round your answer to three decimal places.
1. Define probability:
2. Define statistics:
Chapter 6 Solutions
Essentials of Business Analytics (MindTap Course List)
Ch. 6 - The American League consists of 15 baseball teams....Ch. 6 - The U.S. Golf Association is considering a ban on...Ch. 6 - A simple random sample of 5 months of sales data...Ch. 6 - Morningstar publishes ratings data on 1,208...Ch. 6 - One of the questions in the Pew Internet &...Ch. 6 - In this chapter we showed how a simple random...Ch. 6 - The College Board reported the following mean...Ch. 6 - Prob. 8PCh. 6 - The Economic Policy Institute periodically issues...Ch. 6 - The state of California has a mean annual rainfall...
Ch. 6 - The president of Doerman Distributors, Inc.,...Ch. 6 - Prob. 12PCh. 6 - People end up tossing 12% of what they buy at the...Ch. 6 - Prob. 14PCh. 6 - The International Air Transport Association...Ch. 6 - Prob. 16PCh. 6 - Health insurers are beginning to offer...Ch. 6 - The average annual premium for automobile...Ch. 6 - Prob. 19PCh. 6 - According to Thomson Financial, last year the...Ch. 6 - The Pew Research Center Internet Project conducted...Ch. 6 - For many years businesses have struggled with the...Ch. 6 - The manager of the Danvers-Hilton Resort Hotel...Ch. 6 - The manager of an automobile dealership is...Ch. 6 - A production line operation is designed to fill...Ch. 6 - Because of high production-changeover time and...Ch. 6 - Duke Energy reported that the cost of electricity...Ch. 6 - Prob. 28PCh. 6 - Carpetland salespersons average 8,000 per week in...Ch. 6 - Suppose a new production method will be...Ch. 6 - Prob. 31PCh. 6 - A shareholders’ group, in lodging a protest,...Ch. 6 - Prob. 33PCh. 6 - Prob. 34PCh. 6 - Prob. 35PCh. 6 - According to the National Automobile Dealers...Ch. 6 - What percentage of the population live in their...Ch. 6 - Prob. 38PCh. 6 - Ten years ago 53% of American families owned...Ch. 6 - Prob. 40PCh. 6 - Prob. 41PCh. 6 - Prob. 42PCh. 6 - The Port Authority sells a wide variety of cables...Ch. 6 - The Port Authority also wants to determine if the...Ch. 6 - Prob. 1C
Knowledge Booster


Learn more about
Need a deep-dive on the concept behind this application? Look no further. Learn more about this topic, statistics and related others by exploring similar questions and additional content below.Similar questions
- Results of tossing a coin four times: H, H, H, H How many times is the Coin expected to come up heads? How did you determine this number? Calculate the % deviation. Can these results be used to conclude that a coin is not fair? Why or why not?arrow_forwardCycles to failure Position in ascending order 0.5 f(x)) (x;) Problem 44 Marsha, a renowned cake scientist, is trying to determine how long different cakes can survive intense fork attacks before collapsing into crumbs. To simulate real-world cake consumption, she designs a test where cakes are subjected to repeated fork stabs and bites, mimicking the brutal reality of birthday parties. After rigorous testing, Marsha records 10 observations of how many stabs each cake endured before structural failure. Construct P-P plots for (a.) a normal distribution, (b.) a lognormal distribution, and (c.) a Weibull distribution (using the information included in the table below). Which distribution seems to be the best model for the cycles to failure for this material? Explain your answer in detail. Observation Empirical cumulative Probability distribution Cumulative distribution Inverse of cumulative distribution F-1 (-0.5) F(x)) (S) n 4 3 1 0.05 9 5 2 0.15 7 7 3 0.25 1 10 4 0.35 3 12 5 0.45 Normal…arrow_forwardProblem 3 In their lab, engineer Daniel and Paulina are desperately trying to perfect time travel. But the problem is that their machine still struggles with power inconsistencies-sometimes generating too little energy, other times too much, causing unstable time jumps. To prevent catastrophic misjumps into the Jurassic era or the far future, they must calibrate the machine's power output. After extensive testing, they found that the time machine's power output follows a normal distribution, with an average energy level of 8.7 gigawatts and a standard deviation of 1.2 gigawatts. The Time Travel Safety Board has set strict guidelines: For a successful time jump, the machine's power must be between 8.5 and 9.5 gigawatts. What is the probability that a randomly selected time jump meets this precision requirement? Daniel suggests that adjusting the mean power output could improve time-travel accuracy. Can adjusting the mean reduce the number of dangerous misjumps? If yes, what should the…arrow_forward
- Problem 5 ( Marybeth is also interested in the experiment from Problem 2 (associated with the enhancements for Captain America's shield), so she decides to start a detailed literature review on the subject. Among others, she found a paper where they used a 2"(4-1) fractional factorial design in the factors: (A) shield material, (B) throwing mechanism, (C) edge modification, and (D) handle adjustment. The experimental design used in the paper is shown in the table below. a. Run A B с D 1 (1) -1 -1 -1 1 2 a 1 -1 -1 1 3 bd -1 1 -1 1 4 abd 1 1 -1 1 5 cd -1 -1 1 -1 6 acd 1 -1 1 -1 7 bc -1 1 1 -1 abc 1 1 1 -1 paper? s) What was the generator used in the 2"(4-1) fractional factorial design described in the b. Based on the resolution of this design, what do you think about the generator used in the paper? Do you think it was a good choice, or would you have selected a different one? Explain your answer in detail.arrow_forwardSuppose we wish to test the hypothesis that women with a sister’s history of breast cancer are at higher risk of developing breast cancer themselves. Suppose we assume that the prevalence rate of breast cancer is 3% among 60- to 64-year-old U.S. women, whereas it is 5% among women with a sister history. We propose to interview 400 women 40 to 64 years of age with a sister history of the disease. What is the power of such a study assuming that the level of significance is 10%? I only need help writing the null and alternative hypotheses.arrow_forward4.96 The breaking strengths for 1-foot-square samples of a particular synthetic fabric are approximately normally distributed with a mean of 2,250 pounds per square inch (psi) and a standard deviation of 10.2 psi. Find the probability of selecting a 1-foot-square sample of material at random that on testing would have a breaking strength in excess of 2,265 psi.4.97 Refer to Exercise 4.96. Suppose that a new synthetic fabric has been developed that may have a different mean breaking strength. A random sample of 15 1-foot sections is obtained, and each section is tested for breaking strength. If we assume that the population standard deviation for the new fabric is identical to that for the old fabric, describe the sampling distribution forybased on random samples of 15 1-foot sections of new fabricarrow_forward
- Une Entreprise œuvrant dans le domaine du multividéo donne l'opportunité à ses programmeurs-analystes d'évaluer la performance des cadres supérieurs. Voici les résultats obtenues (sur une échelle de 10 à 50) où 50 représentent une excellente performance. 10 programmeurs furent sélectionnés au hazard pour évaluer deux cadres. Un rapport Excel est également fourni. Programmeurs Cadre A Cadre B 1 34 36 2 32 34 3 18 19 33 38 19 21 21 23 7 35 34 8 20 20 9 34 34 10 36 34 Test d'égalité des espérances: observations pairéesarrow_forwardA television news channel samples 25 gas stations from its local area and uses the results to estimate the average gas price for the state. What’s wrong with its margin of error?arrow_forwardYou’re fed up with keeping Fido locked inside, so you conduct a mail survey to find out people’s opinions on the new dog barking ordinance in a certain city. Of the 10,000 people who receive surveys, 1,000 respond, and only 80 are in favor of it. You calculate the margin of error to be 1.2 percent. Explain why this reported margin of error is misleading.arrow_forward
- You find out that the dietary scale you use each day is off by a factor of 2 ounces (over — at least that’s what you say!). The margin of error for your scale was plus or minus 0.5 ounces before you found this out. What’s the margin of error now?arrow_forwardSuppose that Sue and Bill each make a confidence interval out of the same data set, but Sue wants a confidence level of 80 percent compared to Bill’s 90 percent. How do their margins of error compare?arrow_forwardSuppose that you conduct a study twice, and the second time you use four times as many people as you did the first time. How does the change affect your margin of error? (Assume the other components remain constant.)arrow_forward
arrow_back_ios
SEE MORE QUESTIONS
arrow_forward_ios
Recommended textbooks for you
 College Algebra (MindTap Course List)AlgebraISBN:9781305652231Author:R. David Gustafson, Jeff HughesPublisher:Cengage Learning
 Holt Mcdougal Larson Pre-algebra: Student Edition...AlgebraISBN:9780547587776Author:HOLT MCDOUGALPublisher:HOLT MCDOUGAL
 Glencoe Algebra 1, Student Edition, 9780079039897...AlgebraISBN:9780079039897Author:CarterPublisher:McGraw Hill

College Algebra (MindTap Course List)
Algebra
ISBN:9781305652231
Author:R. David Gustafson, Jeff Hughes
Publisher:Cengage Learning
Holt Mcdougal Larson Pre-algebra: Student Edition...
Algebra
ISBN:9780547587776
Author:HOLT MCDOUGAL
Publisher:HOLT MCDOUGAL
Glencoe Algebra 1, Student Edition, 9780079039897...
Algebra
ISBN:9780079039897
Author:Carter
Publisher:McGraw Hill
Mod-01 Lec-01 Discrete probability distributions (Part 1); Author: nptelhrd;https://www.youtube.com/watch?v=6x1pL9Yov1k;License: Standard YouTube License, CC-BY
Discrete Probability Distributions; Author: Learn Something;https://www.youtube.com/watch?v=m9U4UelWLFs;License: Standard YouTube License, CC-BY
Probability Distribution Functions (PMF, PDF, CDF); Author: zedstatistics;https://www.youtube.com/watch?v=YXLVjCKVP7U;License: Standard YouTube License, CC-BY
Discrete Distributions: Binomial, Poisson and Hypergeometric | Statistics for Data Science; Author: Dr. Bharatendra Rai;https://www.youtube.com/watch?v=lHhyy4JMigg;License: Standard Youtube License