
Concept explainers
Videos
1.
Obtain the
1.
Answer to Problem 1C
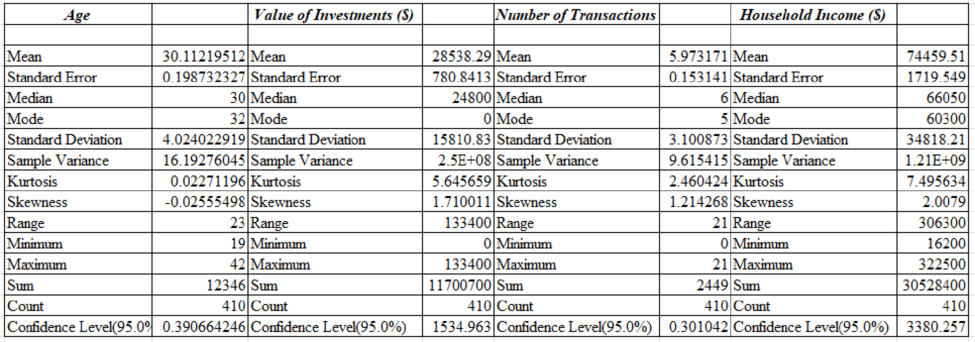
Descriptive statistics for the data is as follows:

Explanation of Solution
Calculation:
The given information is about a young professional magazine. The magazine was successful in two years of publication. The magazine wants to expand the advertising base. The potential advertiser continually asks about the demographics and the interests of the subscribers to young professionals. The magazine conducts a survey to develop subscribers.
Software Procedure:
Step by step procedure to obtain the descriptive statistics using the Excel software:
- Enter the data in Excel spread sheet.
- Choose Data > Data Analysis > Descriptive Statistics.
- In Input
range , select the columns of Age, Investment, Transactions, and Household income. - Select Labels in first row check box and then select the output range.
- Select Summary statistics check box and confidence interval for
Mean check box. - Click OK.
Output using the Excel software is given below:
2.
Find the 95% confidence interval for the mean age and household income of subscribers.
2.
Answer to Problem 1C
There is 95% confidence that the mean of the young professional subscribers of the age between 29.722 and 30.503 and there is 95% confidence that the mean of the young professional subscribers of the household income between $71,079 and $77,840.
Explanation of Solution
From the part (a) output, Mean and Margin of error for Age is 30.1122 and 0.3907. The mean and margin error for Household is 74459.51 and 3380.257.
The 95% confidence interval for the mean age is calculated as follows:
The 95% confidence interval for the mean household is calculated as follows:
Thus, there is 95% confidence that the mean of the young professional subscribers of the age between 29.722 and 30.503. There is 95% confidence that the mean of the young professional subscribers of the household income between $71,079 and $77,840.
3.
Find the 95% confidence interval for the proportion of the subscribers who have the broadband access at home and the proportion of the subscribers who have children.
3.
Answer to Problem 1C
There is 95% confidence that the proportion of the young professional subscribers who have the broadband access between 57.75% and 67.14%.
There is 95% confidence that the proportion of the young professional subscribers who have children between 48.45% and 58.33%.
Explanation of Solution
The proportion of the young professional subscribers who have the broadband access:
Here 256 have access out of 410 subscribers.
Thus, the point estimate
The proportion of the young professional subscribers who have children
Here 219 have children out of 410 subscribers.
Thus, the point estimate
Here, the level of significance is 0.05.
The level of significance or probability for two-tailed is given as
The critical value is calculated by using the excel formula “=NORM.S.INV (probability)”.
Substitute the values in the excel formula: “=NORM.S.INV (0.025)”.
Thus the critical value is obtained as 1.96.
The 95% confidence that the proportion of the young professional subscribers who have the broadband access is given as:
There is 95% confidence that the proportion of the young professional subscribers who have the broadband access between 57.75% and 67.14%.
The 95% confidence 95% confidence that the proportion of the young professional subscribers who have children is given as:
There is 95% confidence that the proportion of the young professional subscribers who have children between 48.45% and 58.33%.
4.
Illustrate whether the young professionals are a good advertising outlet for online brokers or not. Justify with the statistical conclusion.
4.
Answer to Problem 1C
The young professionals are the good advertising outlet for online brokers.
Explanation of Solution
From the results of Part 1, Most of the young professional subscribers have the financial investment for their home as $28,538. Some of them have the amount of investment like more than $100,000. So the mean number of transactions per year is nearly 6 per subscriber and some of the subscribers have mean number of transactions more than 6.
Since the large proportion has the broadband access that is 62.43%. It indicates that most of their subscribers likely to do business.
Thus, young professionals are the good advertising outlet for online brokers.
5.
Illustrate whether the magazine is good place for advertising companies, selling educational software, and computer games for young children.
5.
Explanation of Solution
From the results of Part 1,
The mean age of subscribers is 30.112 years and 53.41% of the subscribers have children. The age of subscribers is reasonable to assume that their children are young age and then they can think that the young age children like about the educational software and the computer games.
Thus, it represents that the subscribers to young professional would be a good target for companies selling educational software and computer games for young children.
6.
Illustrate the types of articles that would be interested to readers of young professionals.
6.
Explanation of Solution
By observing the results in Part 1, most of the young professionals are interested on the investment and for that the investment type of articles may be interested to the professionals. Also, the subscribers who have young children will be interested to read the parenting and child care types of articles.
Want to see more full solutions like this?
Chapter 6 Solutions
Essentials of Business Analytics (MindTap Course List)


- Course Home ✓ Do Homework - Practice Ques ✓ My Uploads | bartleby + mylab.pearson.com/Student/PlayerHomework.aspx?homeworkId=688589738&questionId=5&flushed=false&cid=8110079¢erwin=yes Online SP 2025 STA 2023-009 Yin = Homework: Practice Questions Exam 3 Question list * Question 3 * Question 4 ○ Question 5 K Concluir atualização: Ava Pearl 04/02/25 9:28 AM HW Score: 71.11%, 12.09 of 17 points ○ Points: 0 of 1 Save Listed in the accompanying table are weights (kg) of randomly selected U.S. Army male personnel measured in 1988 (from "ANSUR I 1988") and different weights (kg) of randomly selected U.S. Army male personnel measured in 2012 (from "ANSUR II 2012"). Assume that the two samples are independent simple random samples selected from normally distributed populations. Do not assume that the population standard deviations are equal. Complete parts (a) and (b). Click the icon to view the ANSUR data. a. Use a 0.05 significance level to test the claim that the mean weight of the 1988…arrow_forwardsolving problem 1arrow_forwardselect bmw stock. you can assume the price of the stockarrow_forward
- This problem is based on the fundamental option pricing formula for the continuous-time model developed in class, namely the value at time 0 of an option with maturity T and payoff F is given by: We consider the two options below: Fo= -rT = e Eq[F]. 1 A. An option with which you must buy a share of stock at expiration T = 1 for strike price K = So. B. An option with which you must buy a share of stock at expiration T = 1 for strike price K given by T K = T St dt. (Note that both options can have negative payoffs.) We use the continuous-time Black- Scholes model to price these options. Assume that the interest rate on the money market is r. (a) Using the fundamental option pricing formula, find the price of option A. (Hint: use the martingale properties developed in the lectures for the stock price process in order to calculate the expectations.) (b) Using the fundamental option pricing formula, find the price of option B. (c) Assuming the interest rate is very small (r ~0), use Taylor…arrow_forwardDiscuss and explain in the picturearrow_forwardBob and Teresa each collect their own samples to test the same hypothesis. Bob’s p-value turns out to be 0.05, and Teresa’s turns out to be 0.01. Why don’t Bob and Teresa get the same p-values? Who has stronger evidence against the null hypothesis: Bob or Teresa?arrow_forward
- Review a classmate's Main Post. 1. State if you agree or disagree with the choices made for additional analysis that can be done beyond the frequency table. 2. Choose a measure of central tendency (mean, median, mode) that you would like to compute with the data beyond the frequency table. Complete either a or b below. a. Explain how that analysis can help you understand the data better. b. If you are currently unable to do that analysis, what do you think you could do to make it possible? If you do not think you can do anything, explain why it is not possible.arrow_forward0|0|0|0 - Consider the time series X₁ and Y₁ = (I – B)² (I – B³)Xt. What transformations were performed on Xt to obtain Yt? seasonal difference of order 2 simple difference of order 5 seasonal difference of order 1 seasonal difference of order 5 simple difference of order 2arrow_forwardCalculate the 90% confidence interval for the population mean difference using the data in the attached image. I need to see where I went wrong.arrow_forward
- Microsoft Excel snapshot for random sampling: Also note the formula used for the last column 02 x✓ fx =INDEX(5852:58551, RANK(C2, $C$2:$C$51)) A B 1 No. States 2 1 ALABAMA Rand No. 0.925957526 3 2 ALASKA 0.372999976 4 3 ARIZONA 0.941323044 5 4 ARKANSAS 0.071266381 Random Sample CALIFORNIA NORTH CAROLINA ARKANSAS WASHINGTON G7 Microsoft Excel snapshot for systematic sampling: xfx INDEX(SD52:50551, F7) A B E F G 1 No. States Rand No. Random Sample population 50 2 1 ALABAMA 0.5296685 NEW HAMPSHIRE sample 10 3 2 ALASKA 0.4493186 OKLAHOMA k 5 4 3 ARIZONA 0.707914 KANSAS 5 4 ARKANSAS 0.4831379 NORTH DAKOTA 6 5 CALIFORNIA 0.7277162 INDIANA Random Sample Sample Name 7 6 COLORADO 0.5865002 MISSISSIPPI 8 7:ONNECTICU 0.7640596 ILLINOIS 9 8 DELAWARE 0.5783029 MISSOURI 525 10 15 INDIANA MARYLAND COLORADOarrow_forwardSuppose the Internal Revenue Service reported that the mean tax refund for the year 2022 was $3401. Assume the standard deviation is $82.5 and that the amounts refunded follow a normal probability distribution. Solve the following three parts? (For the answer to question 14, 15, and 16, start with making a bell curve. Identify on the bell curve where is mean, X, and area(s) to be determined. 1.What percent of the refunds are more than $3,500? 2. What percent of the refunds are more than $3500 but less than $3579? 3. What percent of the refunds are more than $3325 but less than $3579?arrow_forwardA normal distribution has a mean of 50 and a standard deviation of 4. Solve the following three parts? 1. Compute the probability of a value between 44.0 and 55.0. (The question requires finding probability value between 44 and 55. Solve it in 3 steps. In the first step, use the above formula and x = 44, calculate probability value. In the second step repeat the first step with the only difference that x=55. In the third step, subtract the answer of the first part from the answer of the second part.) 2. Compute the probability of a value greater than 55.0. Use the same formula, x=55 and subtract the answer from 1. 3. Compute the probability of a value between 52.0 and 55.0. (The question requires finding probability value between 52 and 55. Solve it in 3 steps. In the first step, use the above formula and x = 52, calculate probability value. In the second step repeat the first step with the only difference that x=55. In the third step, subtract the answer of the first part from the…arrow_forward
 Glencoe Algebra 1, Student Edition, 9780079039897...AlgebraISBN:9780079039897Author:CarterPublisher:McGraw Hill
 Holt Mcdougal Larson Pre-algebra: Student Edition...AlgebraISBN:9780547587776Author:HOLT MCDOUGALPublisher:HOLT MCDOUGAL
 Big Ideas Math A Bridge To Success Algebra 1: Stu...AlgebraISBN:9781680331141Author:HOUGHTON MIFFLIN HARCOURTPublisher:Houghton Mifflin Harcourt
 Functions and Change: A Modeling Approach to Coll...AlgebraISBN:9781337111348Author:Bruce Crauder, Benny Evans, Alan NoellPublisher:Cengage Learning