
ELEMENTARY STATISTICS-ALEKS ACCESS CODE
3rd Edition
ISBN: 9781265787219
Author: Navidi
Publisher: MCG
expand_more
expand_more
format_list_bulleted
Concept explainers
Videos
Textbook Question
Chapter 6, Problem 1CQ
Explain why the following is not a
Expert Solution & Answer
To determine
To explain whether the given distribution is probability distribution.
Answer to Problem 1CQ
This is not a probability distribution as the sum of probabilities are not equal to 1.
Explanation of Solution
Given:
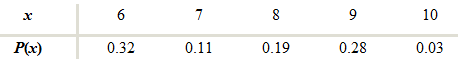
| x | 6 | 7 | 8 | 9 | 10 |
| P(x) | 0.32 | 0.11 | 0.19 | 0.28 | 0.03 |
A distribution is considered as a valid probability distribution when sum of all the probability of all outcomes of an experiment is equal to 1.
Let’s check whether the sum of probability is one or not:
Since the sum of all probabilities is not equal to 1, therefore, it is not a probability distribution.
Want to see more full solutions like this?
Subscribe now to access step-by-step solutions to millions of textbook problems written by subject matter experts!
Students have asked these similar questions
II Consider the following data matrix X:
X1
X2
0.5
0.4
0.2 0.5
0.5
0.5
10.3 10
10.1 10.4
10.1
10.5
What will the resulting clusters be when using the k-Means method with k = 2. In your own words, explain why this result is
indeed expected, i.e. why this clustering minimises the ESS map.
why the answer is 3 and 10?
PS
9 Two films are shown on screen A and screen B at a cinema each evening. The numbers
of people viewing the films on 12 consecutive evenings are shown in the back-to-back
stem-and-leaf diagram.
Screen A (12) Screen B (12)
8
037
34
7 6 4 0 534
74 1645678
92 71689
Key: 116|4 represents 61 viewers for A and 64 viewers for B
A second stem-and-leaf diagram (with rows of the same width as the previous diagram)
is drawn showing the total number of people viewing films at the cinema on each of
these 12 evenings. Find the least and greatest possible number of rows that this second
diagram could have.
TIP
On the evening when 30 people viewed films on screen A, there could have been as few
as 37 or as many as 79 people viewing films on screen B.
Chapter 6 Solutions
ELEMENTARY STATISTICS-ALEKS ACCESS CODE
Ch. 6.1 - Exercises 9-12, fill in each blank with the...Ch. 6.1 - Exercises 9-12, fill in each blank with the...Ch. 6.1 - Exercises 9-12, fill in each blank with the...Ch. 6.1 - Exercises 9-12, fill in each blank with the...Ch. 6.1 - In Exercises 13-16, determine whether the...Ch. 6.1 - In Exercises 13-16, determine whether the...Ch. 6.1 - In Exercises 13-16, determine whether the...Ch. 6.1 - In Exercises 13-16, determine whether the...Ch. 6.1 - In Exercises 17-26, determine whether the random...Ch. 6.1 - In Exercises 17-26, determine whether the random...
Ch. 6.1 - In Exercises 17-26, determine whether the random...Ch. 6.1 - In Exercises 17-26, determine whether the random...Ch. 6.1 - In Exercises 17-26, determine whether the random...Ch. 6.1 - In Exercises 17-26, determine whether the random...Ch. 6.1 - In Exercises 17-26, determine whether the random...Ch. 6.1 - In Exercises 17-26, determine whether the random...Ch. 6.1 - In Exercises 17-26, determine whether the random...Ch. 6.1 - In Exercises 17-26, determine whether the random...Ch. 6.1 - In Exercises 27-32, determine whether the table...Ch. 6.1 - In Exercises 27-32, determine whether the table...Ch. 6.1 - In Exercises 27-32, determine whether the table...Ch. 6.1 - In Exercises 27-32, determine whether the table...Ch. 6.1 - In Exercises 27-32, determine whether the table...Ch. 6.1 - Prob. 32ECh. 6.1 - In Exercises 33-38, compute the mean and standard...Ch. 6.1 - In Exercises 33-38, compute the mean and standard...Ch. 6.1 - In Exercises 33-38, compute the mean and standard...Ch. 6.1 - Prob. 36ECh. 6.1 - In Exercises 33-38, compute the mean and standard...Ch. 6.1 - In Exercises 33-38, compute the mean and standard...Ch. 6.1 - Fill in the value so that the following table...Ch. 6.1 - Fill in the missing value so that the following...Ch. 6.1 - Put some air in your tires: Let X represent the...Ch. 6.1 - Fifteen items or less: The number of customers in...Ch. 6.1 - Defective circuits: The following table presents...Ch. 6.1 - Do you carpool? Let X represent the number of...Ch. 6.1 - Dirty air: The federal government has enacted...Ch. 6.1 - Prob. 46ECh. 6.1 - Relax! The General Social Survey asked 1676 people...Ch. 6.1 - Pain: The General Social Survey asked 827 people...Ch. 6.1 - School days: The following table presents the...Ch. 6.1 - World Cup: The World Cup soccer tournament has...Ch. 6.1 - Lottery: In the New York State Numbers Lottery:...Ch. 6.1 - Lottery: In the New York State Numbers Lottery,...Ch. 6.1 - Craps: In the game of craps, two dice are rolled,...Ch. 6.1 - Prob. 54ECh. 6.1 - Multiple choice: A multiple-choice question has...Ch. 6.1 - Prob. 56ECh. 6.1 - Business projection: An investor is considering a...Ch. 6.1 - Insurance: An insurance company sells a one-year...Ch. 6.1 - Boys and girls: A couple plans to have children...Ch. 6.1 - Girls and boys: In Exercise 59, let X be the...Ch. 6.1 - Success and failure: Three components are randomly...Ch. 6.2 - In Exercises 5-7, fill in each blank with the...Ch. 6.2 - In Exercises 5-7, fill in each blank with the...Ch. 6.2 - In Exercises 5-7, fill in each blank with the...Ch. 6.2 - Prob. 8ECh. 6.2 - In Exercises 8-10, determine whether the statement...Ch. 6.2 - In Exercises 8-10, determine whether the statement...Ch. 6.2 - In Exercises 11-16, determine whether the random...Ch. 6.2 - In Exercises 11-16, determine whether the random...Ch. 6.2 - In Exercises 11-16, determine whether the random...Ch. 6.2 - Prob. 14ECh. 6.2 - In Exercises 11-16, determine whether the random...Ch. 6.2 - Prob. 16ECh. 6.2 - In Exercises 17-26, determine the indicated...Ch. 6.2 - Prob. 18ECh. 6.2 - In Exercises 17-26, determine the indicated...Ch. 6.2 - In Exercises 17-26, determine the indicated...Ch. 6.2 - In Exercises 17-26, determine the indicated...Ch. 6.2 - In Exercises 17-26, determine the indicated...Ch. 6.2 - In Exercises 17-26, determine the indicated...Ch. 6.2 - In Exercises 17-26, determine the indicated...Ch. 6.2 - In Exercises 17-26, determine the indicated...Ch. 6.2 - Prob. 26ECh. 6.2 - Prob. 27ECh. 6.2 - Match each TI-84 PLUS calculator command the...Ch. 6.2 - Take a guess: A student takes a true-false test...Ch. 6.2 - Take another guess: A student takes a...Ch. 6.2 - Your flight has been delayed: At Denver...Ch. 6.2 - Car inspection: Of all the registered automobiles...Ch. 6.2 - Google it: According to a report of the Nielsen...Ch. 6.2 - What should I buy? A study conducted by the Pew...Ch. 6.2 - Blood types: The blood type O negative is called...Ch. 6.2 - Coronary bypass surgery: The Agency for Healthcare...Ch. 6.2 - College bound: The Statistical Abstract of the...Ch. 6.2 - Big babies: The Centers for Disease Control and...Ch. 6.2 - High blood pressure: The National Health and...Ch. 6.2 - Prob. 40ECh. 6.2 - Testing a shipment: A certain large shipment comes...Ch. 6.2 - Smoke detectors: An company offers a discount to...Ch. 6.2 - Prob. 43ECh. 6.3 - In Exercises 5 and 6, fill in each blank with the...Ch. 6.3 - Prob. 6ECh. 6.3 - Prob. 7ECh. 6.3 - Prob. 8ECh. 6.3 - Prob. 9ECh. 6.3 - Prob. 10ECh. 6.3 - Prob. 11ECh. 6.3 - Prob. 12ECh. 6.3 - Prob. 13ECh. 6.3 - Prob. 14ECh. 6.3 - Prob. 15ECh. 6.3 - Prob. 16ECh. 6.3 - Prob. 17ECh. 6.3 - Prob. 18ECh. 6.3 - Prob. 19ECh. 6.3 - Flaws in aluminum foil: The number of flaws in a...Ch. 6.3 - Prob. 21ECh. 6.3 - Prob. 22ECh. 6.3 - Computer messages: The number of tweets received...Ch. 6.3 - Prob. 24ECh. 6.3 - Trees in the forest: The number of trees of a...Ch. 6.3 - Prob. 26ECh. 6.3 - Drive safely: In a recent year, there were...Ch. 6.3 - Prob. 28ECh. 6.3 - Prob. 29ECh. 6 - Explain why the following is not a probability...Ch. 6 - Find die mean of the random variable X with the...Ch. 6 - Refer to Problem 2. the variance of the random...Ch. 6 - Prob. 4CQCh. 6 - Prob. 5CQCh. 6 - Prob. 6CQCh. 6 - Prob. 7CQCh. 6 - Prob. 8CQCh. 6 - At a cell phone battery plant. 5% of cell phone...Ch. 6 - Refer to Problem 9. Find the mean and standard...Ch. 6 - A meteorologist states that the probability of...Ch. 6 - Prob. 12CQCh. 6 - Prob. 13CQCh. 6 - Prob. 14CQCh. 6 - Prob. 15CQCh. 6 - Prob. 1RECh. 6 - Prob. 2RECh. 6 - Prob. 3RECh. 6 - Prob. 4RECh. 6 - Lottery tickets: Several million lottery tickets...Ch. 6 - Prob. 6RECh. 6 - Prob. 7RECh. 6 - Prob. 8RECh. 6 - Reading tests: According to the National Center...Ch. 6 - Prob. 10RECh. 6 - Prob. 11RECh. 6 - Prob. 12RECh. 6 - Prob. 13RECh. 6 - Prob. 14RECh. 6 - Prob. 15RECh. 6 - Prob. 1WAICh. 6 - Prob. 2WAICh. 6 - Prob. 3WAICh. 6 - When a population mean is unknown, people will...Ch. 6 - Provide an example of a random variable and...Ch. 6 - Prob. 6WAICh. 6 - Prob. 7WAICh. 6 - Prob. 1CS
Knowledge Booster


Learn more about
Need a deep-dive on the concept behind this application? Look no further. Learn more about this topic, statistics and related others by exploring similar questions and additional content below.Similar questions
- Q.2.4 There are twelve (12) teams participating in a pub quiz. What is the probability of correctly predicting the top three teams at the end of the competition, in the correct order? Give your final answer as a fraction in its simplest form.arrow_forwardThe table below indicates the number of years of experience of a sample of employees who work on a particular production line and the corresponding number of units of a good that each employee produced last month. Years of Experience (x) Number of Goods (y) 11 63 5 57 1 48 4 54 5 45 3 51 Q.1.1 By completing the table below and then applying the relevant formulae, determine the line of best fit for this bivariate data set. Do NOT change the units for the variables. X y X2 xy Ex= Ey= EX2 EXY= Q.1.2 Estimate the number of units of the good that would have been produced last month by an employee with 8 years of experience. Q.1.3 Using your calculator, determine the coefficient of correlation for the data set. Interpret your answer. Q.1.4 Compute the coefficient of determination for the data set. Interpret your answer.arrow_forwardCan you answer this question for mearrow_forward
- Techniques QUAT6221 2025 PT B... TM Tabudi Maphoru Activities Assessments Class Progress lIE Library • Help v The table below shows the prices (R) and quantities (kg) of rice, meat and potatoes items bought during 2013 and 2014: 2013 2014 P1Qo PoQo Q1Po P1Q1 Price Ро Quantity Qo Price P1 Quantity Q1 Rice 7 80 6 70 480 560 490 420 Meat 30 50 35 60 1 750 1 500 1 800 2 100 Potatoes 3 100 3 100 300 300 300 300 TOTAL 40 230 44 230 2 530 2 360 2 590 2 820 Instructions: 1 Corall dawn to tha bottom of thir ceraan urina se se tha haca nariad in archerca antarand cubmit Q Search ENG US 口X 2025/05arrow_forwardThe table below indicates the number of years of experience of a sample of employees who work on a particular production line and the corresponding number of units of a good that each employee produced last month. Years of Experience (x) Number of Goods (y) 11 63 5 57 1 48 4 54 45 3 51 Q.1.1 By completing the table below and then applying the relevant formulae, determine the line of best fit for this bivariate data set. Do NOT change the units for the variables. X y X2 xy Ex= Ey= EX2 EXY= Q.1.2 Estimate the number of units of the good that would have been produced last month by an employee with 8 years of experience. Q.1.3 Using your calculator, determine the coefficient of correlation for the data set. Interpret your answer. Q.1.4 Compute the coefficient of determination for the data set. Interpret your answer.arrow_forwardQ.3.2 A sample of consumers was asked to name their favourite fruit. The results regarding the popularity of the different fruits are given in the following table. Type of Fruit Number of Consumers Banana 25 Apple 20 Orange 5 TOTAL 50 Draw a bar chart to graphically illustrate the results given in the table.arrow_forward
- Q.2.3 The probability that a randomly selected employee of Company Z is female is 0.75. The probability that an employee of the same company works in the Production department, given that the employee is female, is 0.25. What is the probability that a randomly selected employee of the company will be female and will work in the Production department? Q.2.4 There are twelve (12) teams participating in a pub quiz. What is the probability of correctly predicting the top three teams at the end of the competition, in the correct order? Give your final answer as a fraction in its simplest form.arrow_forwardQ.2.1 A bag contains 13 red and 9 green marbles. You are asked to select two (2) marbles from the bag. The first marble selected will not be placed back into the bag. Q.2.1.1 Construct a probability tree to indicate the various possible outcomes and their probabilities (as fractions). Q.2.1.2 What is the probability that the two selected marbles will be the same colour? Q.2.2 The following contingency table gives the results of a sample survey of South African male and female respondents with regard to their preferred brand of sports watch: PREFERRED BRAND OF SPORTS WATCH Samsung Apple Garmin TOTAL No. of Females 30 100 40 170 No. of Males 75 125 80 280 TOTAL 105 225 120 450 Q.2.2.1 What is the probability of randomly selecting a respondent from the sample who prefers Garmin? Q.2.2.2 What is the probability of randomly selecting a respondent from the sample who is not female? Q.2.2.3 What is the probability of randomly…arrow_forwardTest the claim that a student's pulse rate is different when taking a quiz than attending a regular class. The mean pulse rate difference is 2.7 with 10 students. Use a significance level of 0.005. Pulse rate difference(Quiz - Lecture) 2 -1 5 -8 1 20 15 -4 9 -12arrow_forward
- The following ordered data list shows the data speeds for cell phones used by a telephone company at an airport: A. Calculate the Measures of Central Tendency from the ungrouped data list. B. Group the data in an appropriate frequency table. C. Calculate the Measures of Central Tendency using the table in point B. D. Are there differences in the measurements obtained in A and C? Why (give at least one justified reason)? I leave the answers to A and B to resolve the remaining two. 0.8 1.4 1.8 1.9 3.2 3.6 4.5 4.5 4.6 6.2 6.5 7.7 7.9 9.9 10.2 10.3 10.9 11.1 11.1 11.6 11.8 12.0 13.1 13.5 13.7 14.1 14.2 14.7 15.0 15.1 15.5 15.8 16.0 17.5 18.2 20.2 21.1 21.5 22.2 22.4 23.1 24.5 25.7 28.5 34.6 38.5 43.0 55.6 71.3 77.8 A. Measures of Central Tendency We are to calculate: Mean, Median, Mode The data (already ordered) is: 0.8, 1.4, 1.8, 1.9, 3.2, 3.6, 4.5, 4.5, 4.6, 6.2, 6.5, 7.7, 7.9, 9.9, 10.2, 10.3, 10.9, 11.1, 11.1, 11.6, 11.8, 12.0, 13.1, 13.5, 13.7, 14.1, 14.2, 14.7, 15.0, 15.1, 15.5,…arrow_forwardPEER REPLY 1: Choose a classmate's Main Post. 1. Indicate a range of values for the independent variable (x) that is reasonable based on the data provided. 2. Explain what the predicted range of dependent values should be based on the range of independent values.arrow_forwardIn a company with 80 employees, 60 earn $10.00 per hour and 20 earn $13.00 per hour. Is this average hourly wage considered representative?arrow_forward
arrow_back_ios
SEE MORE QUESTIONS
arrow_forward_ios
Recommended textbooks for you
 Holt Mcdougal Larson Pre-algebra: Student Edition...AlgebraISBN:9780547587776Author:HOLT MCDOUGALPublisher:HOLT MCDOUGAL

 College Algebra (MindTap Course List)AlgebraISBN:9781305652231Author:R. David Gustafson, Jeff HughesPublisher:Cengage Learning
 College AlgebraAlgebraISBN:9781305115545Author:James Stewart, Lothar Redlin, Saleem WatsonPublisher:Cengage Learning
Holt Mcdougal Larson Pre-algebra: Student Edition...
Algebra
ISBN:9780547587776
Author:HOLT MCDOUGAL
Publisher:HOLT MCDOUGAL
College Algebra (MindTap Course List)
Algebra
ISBN:9781305652231
Author:R. David Gustafson, Jeff Hughes
Publisher:Cengage Learning
College Algebra
Algebra
ISBN:9781305115545
Author:James Stewart, Lothar Redlin, Saleem Watson
Publisher:Cengage Learning
Mod-01 Lec-01 Discrete probability distributions (Part 1); Author: nptelhrd;https://www.youtube.com/watch?v=6x1pL9Yov1k;License: Standard YouTube License, CC-BY
Discrete Probability Distributions; Author: Learn Something;https://www.youtube.com/watch?v=m9U4UelWLFs;License: Standard YouTube License, CC-BY
Probability Distribution Functions (PMF, PDF, CDF); Author: zedstatistics;https://www.youtube.com/watch?v=YXLVjCKVP7U;License: Standard YouTube License, CC-BY
Discrete Distributions: Binomial, Poisson and Hypergeometric | Statistics for Data Science; Author: Dr. Bharatendra Rai;https://www.youtube.com/watch?v=lHhyy4JMigg;License: Standard Youtube License