Biological Science (6th Edition)
6th Edition
ISBN: 9780321976499
Author: Scott Freeman, Kim Quillin, Lizabeth Allison, Michael Black, Emily Taylor, Greg Podgorski, Jeff Carmichael
Publisher: PEARSON
expand_more
expand_more
format_list_bulleted
Concept explainers
Question
Chapter 53, Problem 15PIAT
Summary Introduction
To review:
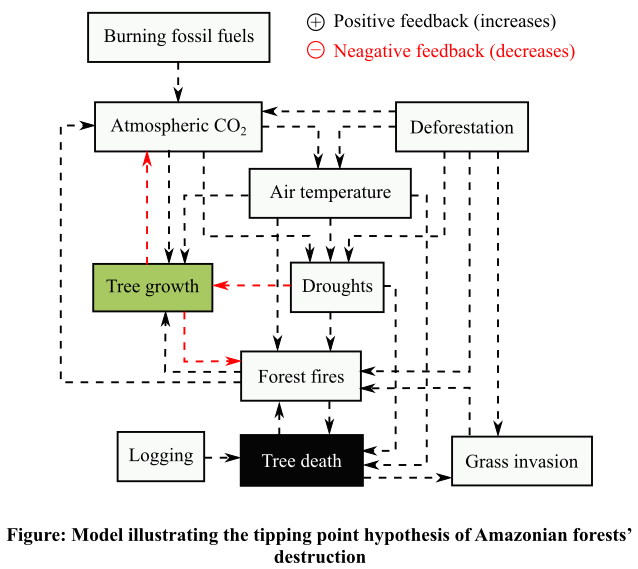
The model illustrating the tipping point hypothesis of Amazonian forests’ destruction.
Introduction:
Amazonian forests are highly productive and harbor a rich flora and fauna. They are also highly fragile at the same time. As a result of anthropogenic activities and global warming, these forests are facing a threat of extinction.
The positive feedback loops among numerous variables in the Amazon will cause the transformation of forests into grasslands. The positive feedback loops due to these increased activities are illustrated in the figure given below:
Expert Solution & Answer
Want to see the full answer?
Check out a sample textbook solutionStudents have asked these similar questions
PLEASE ANSWER A AND B
As we know, energy is lost moving from one trophic level to the next (total energy moved from one trophic level to the next is usually estimated at 10%). The total loss is known as trophic efficiency. Trophic efficiency is made of 3 parts (3 places where energy is lost). You need to pick TWO of the three individual efficiencies that make up the overall trophic efficiency and for EACH, tell me:
a. What do we call this part of trophic efficiency?
b. How is energy lost in this part of trophic efficiency?
c. We discussed characteristics of an organism or environment that made it more or less efficient in certain parts of trophic efficiency (we did not use this one in class, but for instance, endoparasites have a higher xxxxxxx efficiency than ectoparasites). Tell me what characteristics of an organism/ecosystem (other than the example above) would make it more or less efficient for this part of Trophic efficiency. (Make sure to say what characteristics makes it…
A conceptual model representing the role, interaction, reaction, and density of essential ecosystem components is shown below. Examine the model and the relationships between the major players (i.e., predator, prey, producer).
The structure's most important role is played by these major players. It's also worth noting that nutrition has been included in the model. This is the abiotic component that has a direct or indirect impact on the interaction.
Question: What can be deduced about the center of the circle?
Introduction: from where are you, which town and country?
a, Give a short description of the vegetation in your region and explain the current way of veld utilization in that region.
b, which negative or positive aspects con you identify with the current way of utilization? emphasize any negative and /or positive aspects ( for instance continuous vs rotational grazing)
c, Give possible (scientific) solutions for the identified problems for example:
c1, the advantages of keeping correct animal numbers.
c2, An example of a proper rotational grazing
c3, ways in which degraded areas (overgrazed, bare areas, eroded, bush encroached) can be treated (or which actions can be implemented) to improve the veld condition.
Chapter 53 Solutions
Biological Science (6th Edition)
Ch. 53 - What is the main global reservoir of nitrogen?Ch. 53 - Prob. 2TYKCh. 53 - Prob. 3TYKCh. 53 - Devegetation has what effect on ecosystem...Ch. 53 - Prob. 5TYUCh. 53 - Explain why decomposition rates in a field in...Ch. 53 - Why are the open oceans nutrient poor? Why are...Ch. 53 - Prob. 8TYUCh. 53 - Prob. 9TYPSSCh. 53 - During the Carboniferous period, rates of...
Knowledge Booster
Learn more about
Need a deep-dive on the concept behind this application? Look no further. Learn more about this topic, biology and related others by exploring similar questions and additional content below.Similar questions
- Which of the following statements BEST describes energy transfer in an ecosystem? A. If the primary producer has 175,000 kcal available, the secondary consumer will receive 17,500 kcal from the primary consumer. B. If the primary consumer has 175,000 kcal available, the secondary consumer will receive 17,500 kcal from the primary consumer. C. If the primary consumer has 175,000 kcal available, the tertiary consumer will receive 175 kcal from the secondary consumer. D. If the primary producer has 175,000 kcal available, the tertiary consumer will receive 17,500 kcal from the secondary consumer.arrow_forwardA conceptual model representing the role, interaction, reaction, and density of essential ecosystem components is shown below. Examine the model and the relationships between the major players (i.e., predator, prey, producer). The structure's most important role is played by these major players. It's also worth noting that nutrition has been included in the model. This is the abiotic component that has a direct or indirect impact on the interaction. Question: Based on this scenario, what is the most significant role of sea otters in the marine community? Why it’s important?arrow_forwardhttps://www.biointeractive.org/classroom-resources/exploring-trophic-cascades create a case study based on additional research into other examples of trophic cascades. describe and illustrate how changes in an organismal population can have unintended effects on trophic levels or ecosystems. Identify the organisms and nutrients (if applicable) that are present in your trophic pyramid. Describe the normal flow of your trophic cascade along with whether removal or introduction of the organism has a positive or negative effect on other organisms or nutrient levels within an ecosystem.arrow_forward
- Construct a biomass pyramid for the following hypothetical scenario. Be sure to include all four trophic levels in the pyramid, and provide the total biomass of living things found at each level. Be sure to include units, and label each trophic level. The shape of your pyramid should be based on the biomass of each trophic level. Levels with more biomass should be drawn wider, and levels with less biomass should be drawn thinner. Note that your biomass pyramid may or may not be a true pyramid. Scenario: Hickory Run Nature Reserve is a 150-acre conservation area filled with plants and animals native to the Mid-Atlantic region of the United States. A baseline study was done to determine the total biomass of producers and consumers living on the reserve. Baseline data will be compared to data collected in future years to determine trends in species accumulation or loss. This comparison is important because the region surrounding the reserve is experiencing a high rate of human development…arrow_forwardThe Jena experiment tested the effects of plant species richness on the ecosystem function of various grassland areas over a 15-year timespan. Ecosystem function was determined by measuring the biomass, soil characteristics, types, and numbers of producers and consumers in the area, and tested to determine the strength of the biodiversity effect on the ecosystem. The graphs show the ecosystem function at the onset of the experiment (dotted line) versus the ecosystem function at the end of the 15-year experiment (solid line) in four different test sites (A, B, C, and D).arrow_forwardCreate a model which accurately, in detail, depicts the potential pathways of carbon (biomass) and energy in an ecosystem with at least five trophic levels (don’t forget your decomposers, they can count as one trophic level). Make sure to incorporate the multiple pathways that biomass and energy could take at each trophic level. Lastly, clearly illustrate how carbon and energy flow in this ecosystem. Be sure to include adequate levels of detail for all pathways and differentiate the flow of carbon and energy in your model.arrow_forward
- A conceptual model representing the role, interaction, reaction, and density of essential ecosystem components is shown below. Examine the model and the relationships between the major players (i.e., predator, prey, producer). The structure's most important role is played by these major players. It's also worth noting that nutrition has been included in the model. This is the abiotic component that has a direct or indirect impact on the interaction. Question: Why does the organism’s interaction appear in an oscillating pattern? What does it suggest?arrow_forwardSupport this with evidence: In this food web model, plants A, B and C are the autotrophic organisms that serve as the producers of the food web model. The herbivores A, B and C serve as the primary consumers meanwhile the omnivores A and B serve as the secondary consumers of this model. Then, the last level is the top predator. To describe the model formulated, the populations of these organisms, in a particular ecosystem, was recorded over a period of 61 days. It is observed that at Day 0, the plant populations are the highest, which is around 5000. The herbivore populations are found in a range of 2000-3000 and the omnivore populations can be seen to be below 1000. With gradual increase in the number of days, we can see here that the food chain is coming into play. The green plants are being consumed by the herbivores, leading to fluctuations in the plant populations. The herbivores are, in turn, being consumed by the omnivores. We can see that with increasing time, only…arrow_forwardMake a claim or observation about dead zones and nitrogen input in the Chesapeake Bay that is supported by the data in these figures. There is no single right answer to this question--any additional information that you can get from these figures counts! Note: Your observation should be more than stating the correlation (or lack of correlation) between the two variables.arrow_forward
- Draw a food chain showing the relationships between these organisms, indicating the direction of the flow of energy. Which organism is at the top of this food chain? Calculate the standing crop biomass in each trophic level (C = A × B).arrow_forwardIn constructing a mathematical model for population growth of tilapia grown in fishpens, which factor(s) may be included in model.arrow_forwardThis conceptual model to the right shows the flow of energy through a spring ecosystem in Silver Springs, Florida from Figure 46.8 in your textbook. 7a. Which value/number on this diagram represents gross primary productivity (GPP)? Express using the units kcal/m?/yr. Sunlight 1,700,000 kcalim?lyr Primary producers 13,187 20,810 7,618 4,250 Primary consumers 7b. Which value/number represents net primary productivity (NPP)? Express using the units kcal/m?/yr. 2,265 3,368 1,103 720 Secondary consumers 272 383 111 90 7c. What accounts for the difference in GPP and NPP? Tertiary consumers 16 21 5 Decomposers 7d. What is the efficiency of energy transfer between the primary producers and the primary consumers? Is this more or less efficient than the transfer between a 5,060 5,060 Total heat and respiration 20,810 secondary consumer and tertiary consumer? Explain. respiration + heat to decomposersarrow_forward
arrow_back_ios
SEE MORE QUESTIONS
arrow_forward_ios
Recommended textbooks for you
- Biology: The Dynamic Science (MindTap Course List)BiologyISBN:9781305389892Author:Peter J. Russell, Paul E. Hertz, Beverly McMillanPublisher:Cengage Learning
Biology: The Dynamic Science (MindTap Course List)
Biology
ISBN:9781305389892
Author:Peter J. Russell, Paul E. Hertz, Beverly McMillan
Publisher:Cengage Learning
Microorganisms | Genetics | Biology | FuseSchool; Author: FuseSchool - Global Education;https://www.youtube.com/watch?v=YSitT0oOoyc;License: Standard youtube license