
Videos
a.
To find: A sine model using sine regression feature of a graphing utility to fit each set of data.
a.
Answer to Problem 115E
A sine model for the temperature
with
A sine model for the temperature
Explanation of Solution
Given information:
The following table with Temperature
Calculation:
To find a sine model for the temperature
Then use the sine regression feature of the graphing utility. To find a sine model, enter the following equation:
Press Enter.
The following equation will be obtained:
Follow the same procedure to find the sine model for temperature
The sine model for temperature
b.
To graph: Each model from part(a) with original data.
b.
Explanation of Solution
Given information:
The following table with Temperature
Graph:
On plotting the data and on finding the sine model using the
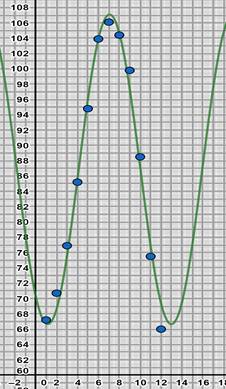
On plotting the data and on finding the sine model using the
Interpretation:
The graph of the sine model is a best fit line for the scatter plot of the temperature.
c.
To find: The month(s) in which the given high temperature is most likely reported in each city.
c.
Answer to Problem 115E
Yakima may report a daily high temperature of
Explanation of Solution
Given information:
The following table with Temperature
Normal daily high temperature reported =
Phoenix has high temperatures above
d.
To find: The month(s) in which the given high temperature is most likely reported in each city.
d.
Answer to Problem 115E
A daily high temperature of
Explanation of Solution
Given information:
The following table with Temperature
Normal daily high temperature reported =
Phoenix has high temperatures above
e.
To find: The month(s) in which the given high temperature is most likely reported in each city.
e.
Answer to Problem 115E
Phoenix may report a daily high temperature of
Explanation of Solution
Given information:
The following table with Temperature
Normal daily high temperature reported =
Phoenix has a high temperature of
e.
To find: The month(s) in which the given high temperature is most likely reported in each city.
e.
Answer to Problem 115E
Phoenix may report a daily high temperature of
Explanation of Solution
Given information:
The following table with Temperature
Normal daily high temperature reported =
Phoenix has a high temperature of
Chapter 5 Solutions
PRECALCULUS W/LIMITS:GRAPH.APPROACH(HS)


- (7) (12 points) Let F(x, y, z) = (y, x+z cos yz, y cos yz). Ꮖ (a) (4 points) Show that V x F = 0. (b) (4 points) Find a potential f for the vector field F. (c) (4 points) Let S be a surface in R3 for which the Stokes' Theorem is valid. Use Stokes' Theorem to calculate the line integral Jos F.ds; as denotes the boundary of S. Explain your answer.arrow_forward(3) (16 points) Consider z = uv, u = x+y, v=x-y. (a) (4 points) Express z in the form z = fog where g: R² R² and f: R² → R. (b) (4 points) Use the chain rule to calculate Vz = (2, 2). Show all intermediate steps otherwise no credit. (c) (4 points) Let S be the surface parametrized by T(x, y) = (x, y, ƒ (g(x, y)) (x, y) = R². Give a parametric description of the tangent plane to S at the point p = T(x, y). (d) (4 points) Calculate the second Taylor polynomial Q(x, y) (i.e. the quadratic approximation) of F = (fog) at a point (a, b). Verify that Q(x,y) F(a+x,b+y). =arrow_forward(6) (8 points) Change the order of integration and evaluate (z +4ry)drdy . So S√ ² 0arrow_forward
- (10) (16 points) Let R>0. Consider the truncated sphere S given as x² + y² + (z = √15R)² = R², z ≥0. where F(x, y, z) = −yi + xj . (a) (8 points) Consider the vector field V (x, y, z) = (▼ × F)(x, y, z) Think of S as a hot-air balloon where the vector field V is the velocity vector field measuring the hot gasses escaping through the porous surface S. The flux of V across S gives the volume flow rate of the gasses through S. Calculate this flux. Hint: Parametrize the boundary OS. Then use Stokes' Theorem. (b) (8 points) Calculate the surface area of the balloon. To calculate the surface area, do the following: Translate the balloon surface S by the vector (-15)k. The translated surface, call it S+ is part of the sphere x² + y²+z² = R². Why do S and S+ have the same area? ⚫ Calculate the area of S+. What is the natural spherical parametrization of S+?arrow_forward(1) (8 points) Let c(t) = (et, et sint, et cost). Reparametrize c as a unit speed curve starting from the point (1,0,1).arrow_forward(9) (16 points) Let F(x, y, z) = (x² + y − 4)i + 3xyj + (2x2 +z²)k = - = (x²+y4,3xy, 2x2 + 2²). (a) (4 points) Calculate the divergence and curl of F. (b) (6 points) Find the flux of V x F across the surface S given by x² + y²+2² = 16, z ≥ 0. (c) (6 points) Find the flux of F across the boundary of the unit cube E = [0,1] × [0,1] x [0,1].arrow_forward
- (8) (12 points) (a) (8 points) Let C be the circle x² + y² = 4. Let F(x, y) = (2y + e²)i + (x + sin(y²))j. Evaluate the line integral JF. F.ds. Hint: First calculate V x F. (b) (4 points) Let S be the surface r² + y² + z² = 4, z ≤0. Calculate the flux integral √(V × F) F).dS. Justify your answer.arrow_forwardDetermine whether the Law of Sines or the Law of Cosines can be used to find another measure of the triangle. a = 13, b = 15, C = 68° Law of Sines Law of Cosines Then solve the triangle. (Round your answers to four decimal places.) C = 15.7449 A = 49.9288 B = 62.0712 × Need Help? Read It Watch Itarrow_forward(4) (10 points) Evaluate √(x² + y² + z²)¹⁄² exp[}(x² + y² + z²)²] dV where D is the region defined by 1< x² + y²+ z² ≤4 and √√3(x² + y²) ≤ z. Note: exp(x² + y²+ 2²)²] means el (x²+ y²+=²)²]¸arrow_forward
- (2) (12 points) Let f(x,y) = x²e¯. (a) (4 points) Calculate Vf. (b) (4 points) Given x directional derivative 0, find the line of vectors u = D₁f(x, y) = 0. (u1, 2) such that the - (c) (4 points) Let u= (1+3√3). Show that Duƒ(1, 0) = ¦|▼ƒ(1,0)| . What is the angle between Vf(1,0) and the vector u? Explain.arrow_forwardFind the missing values by solving the parallelogram shown in the figure. (The lengths of the diagonals are given by c and d. Round your answers to two decimal places.) a b 29 39 66.50 C 17.40 d 0 54.0 126° a Ꮎ b darrow_forward(5) (10 points) Let D be the parallelogram in the xy-plane with vertices (0, 0), (1, 1), (1, 1), (0, -2). Let f(x,y) = xy/2. Use the linear change of variables T(u, v)=(u,u2v) = (x, y) 1 to calculate the integral f(x,y) dA= 0 ↓ The domain of T is a rectangle R. What is R? |ǝ(x, y) du dv. |ð(u, v)|arrow_forward
 Calculus: Early TranscendentalsCalculusISBN:9781285741550Author:James StewartPublisher:Cengage Learning
 Thomas' Calculus (14th Edition)CalculusISBN:9780134438986Author:Joel R. Hass, Christopher E. Heil, Maurice D. WeirPublisher:PEARSON
 Calculus: Early Transcendentals (3rd Edition)CalculusISBN:9780134763644Author:William L. Briggs, Lyle Cochran, Bernard Gillett, Eric SchulzPublisher:PEARSON
 Calculus: Early TranscendentalsCalculusISBN:9781319050740Author:Jon Rogawski, Colin Adams, Robert FranzosaPublisher:W. H. Freeman
 Calculus: Early Transcendental FunctionsCalculusISBN:9781337552516Author:Ron Larson, Bruce H. EdwardsPublisher:Cengage Learning