
Videos
a.
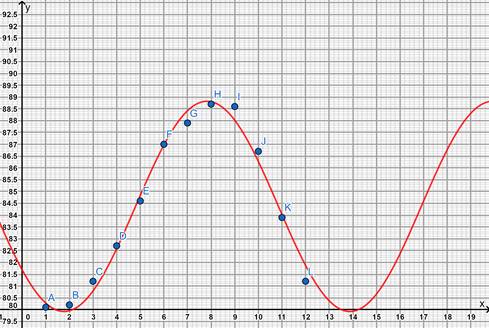
To graph: A
a.
Explanation of Solution
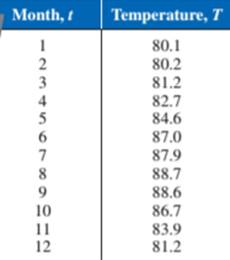
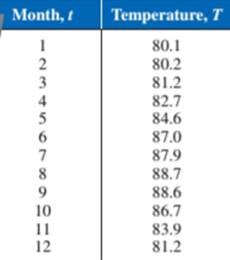
Given information:
The following table with Temperature

Graph:
Plot the points in the above table on a graph using a graphing utility.
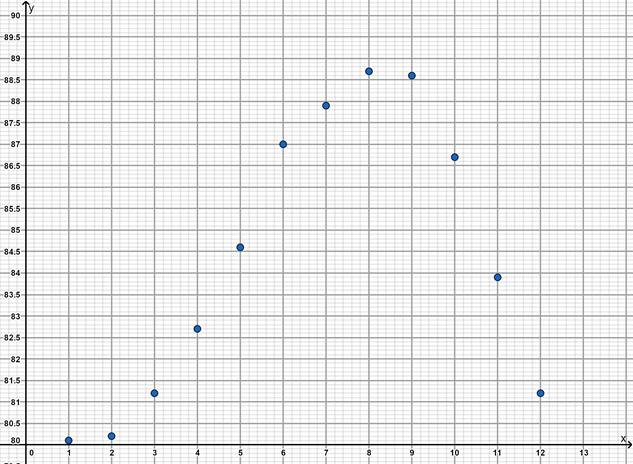
Interpretation:
The graph is in the form of a half wave.
b.
To find: A sine model for the temperature.
b.
Answer to Problem 104E
A sine model for the temperature is as follows:
with
Explanation of Solution
Given information:
The following table with Temperature

Calculation:
To find a sine model for the temperature, plot all the points on the graph Then, make a list of all the points using the
Then use the sine regression feature of the graphing utility. To find a sine model, enter the following equation:
Press Enter.
The following equation will be obtained:
c.
To graph: The scatter plot and the sine model in the same widow
c.
Explanation of Solution
Given information:
The following table with Temperature
Graph:
On plotting the data(as explained in subpart a) and on finding the sine model using the

Interpretation:
The graph of the sine model is a best fit line for the scatter plot of the temperature.
d.
To find: The average temperature using the term in part (b).
d.
Answer to Problem 104E
The average temperature using the term in part (b) is as follows:

Explanation of Solution
Given information:
The following table with Temperature

The model obtained in part(b) is as follows:
Where
The average daily temperature using this model is obtained by creating a table of values using this model. Create a table that shows the values of
Here
e.
To describe: The months in which the daily high temperature is above
e.
Answer to Problem 104E
The months in which the daily high temperature is above
June, July, August, September and October.
Explanation of Solution
Given information:
The following table with Temperature
As obtained in part(c), the graph of the daily high temperatures is as follows:
As observed from the graph, the daily high temperature is above
These months correspond to June, July, August, September and October.
Chapter 5 Solutions
PRECALCULUS W/LIMITS:GRAPH.APPROACH(HS)


- please do Q3arrow_forwardUse the properties of logarithms, given that In(2) = 0.6931 and In(3) = 1.0986, to approximate the logarithm. Use a calculator to confirm your approximations. (Round your answers to four decimal places.) (a) In(0.75) (b) In(24) (c) In(18) 1 (d) In ≈ 2 72arrow_forwardFind the indefinite integral. (Remember the constant of integration.) √tan(8x) tan(8x) sec²(8x) dxarrow_forward
- Find the indefinite integral by making a change of variables. (Remember the constant of integration.) √(x+4) 4)√6-x dxarrow_forwarda -> f(x) = f(x) = [x] show that whether f is continuous function or not(by using theorem) Muslim_mathsarrow_forwardUse Green's Theorem to evaluate F. dr, where F = (√+4y, 2x + √√) and C consists of the arc of the curve y = 4x - x² from (0,0) to (4,0) and the line segment from (4,0) to (0,0).arrow_forward
- Evaluate F. dr where F(x, y, z) = (2yz cos(xyz), 2xzcos(xyz), 2xy cos(xyz)) and C is the line π 1 1 segment starting at the point (8, ' and ending at the point (3, 2 3'6arrow_forwardCan you help me find the result of an integral + a 炉[メをメ +炉なarrow_forward2 a Can you help me find the result of an integral a 아 x² dxarrow_forward
 Calculus: Early TranscendentalsCalculusISBN:9781285741550Author:James StewartPublisher:Cengage Learning
 Thomas' Calculus (14th Edition)CalculusISBN:9780134438986Author:Joel R. Hass, Christopher E. Heil, Maurice D. WeirPublisher:PEARSON
 Calculus: Early Transcendentals (3rd Edition)CalculusISBN:9780134763644Author:William L. Briggs, Lyle Cochran, Bernard Gillett, Eric SchulzPublisher:PEARSON
 Calculus: Early TranscendentalsCalculusISBN:9781319050740Author:Jon Rogawski, Colin Adams, Robert FranzosaPublisher:W. H. Freeman
 Calculus: Early Transcendental FunctionsCalculusISBN:9781337552516Author:Ron Larson, Bruce H. EdwardsPublisher:Cengage Learning