
Statistical Reasoning for Everyday Life (5th Edition)
5th Edition
ISBN: 9780134494043
Author: Jeff Bennett, William L. Briggs, Mario F. Triola
Publisher: PEARSON
expand_more
expand_more
format_list_bulleted
Concept explainers
Videos
Textbook Question
Chapter 5.1, Problem 24E
Areas and Relative Frequencies. Consider the graph of the
a. What is the total area under the curve?
b. Estimate (using area) the relative frequency of values less than 100.
c. Estimate the relative frequency of values greater than 110.
d. Estimate the relative frequency of values less than 110.
e. Estimate the relative frequency of values between 100 and 110.
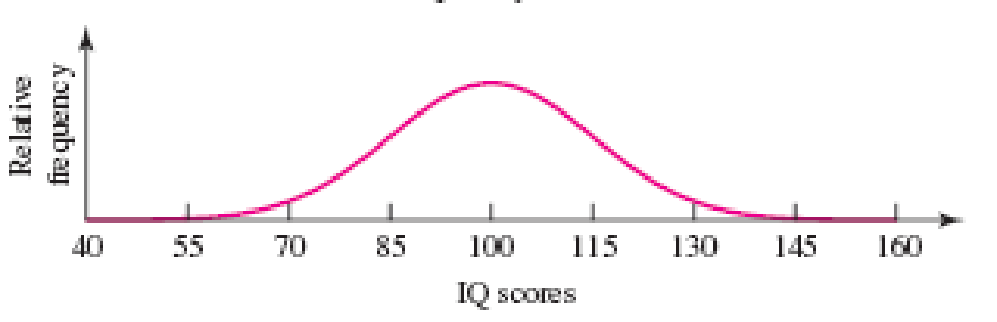
Figure 5.13
Expert Solution & Answer
Want to see the full answer?
Check out a sample textbook solution
Students have asked these similar questions
A well-known company predominantly makes flat pack furniture for students. Variability with the automated machinery means the wood components are cut with a standard deviation in length of 0.45 mm. After they are cut the components are measured. If their length is more than 1.2 mm from the required length, the components are rejected.
a) Calculate the percentage of components that get rejected.
b) In a manufacturing run of 1000 units, how many are expected to be rejected?
c) The company wishes to install more accurate equipment in order to reduce the rejection rate by one-half, using the same ±1.2mm rejection criterion. Calculate the maximum acceptable standard deviation of the new process.
5. Let X and Y be independent random variables and let the superscripts denote
symmetrization (recall Sect. 3.6). Show that
(X + Y) X+ys.
8. Suppose that the moments of the random variable X are constant, that is, suppose
that EX" =c for all n ≥ 1, for some constant c. Find the distribution of X.
Chapter 5 Solutions
Statistical Reasoning for Everyday Life (5th Edition)
Ch. 5.1 - Normal Distribution. When we refer to a normal...Ch. 5.1 - Normal Shape. Draw a rough sketch of a normal...Ch. 5.1 - Area Under the Curve. What does the area under the...Ch. 5.1 - Normal Conditions. Briefly describe the four...Ch. 5.1 - Does It Make Sense? For Exercises 58, determine...Ch. 5.1 - Does It Make Sense? For Exercises 58, determine...Ch. 5.1 - Does It Make Sense? For Exercises 58, determine...Ch. 5.1 - Does It Make Sense? For Exercises 58, determine...Ch. 5.1 - What Is Normal? Identify the distribution in...Ch. 5.1 - What Is Normal? Identify the distribution in...
Ch. 5.1 - Normal Distributions. For each of the data sets in...Ch. 5.1 - Normal Distributions. For each of the data sets in...Ch. 5.1 - Normal Distributions. For each of the data sets in...Ch. 5.1 - Normal Distributions. For each of the data sets in...Ch. 5.1 - Normal Distributions. For each of the data sets in...Ch. 5.1 - Normal Distributions. For each of the data sets in...Ch. 5.1 - Normal Distributions. For each of the data sets in...Ch. 5.1 - Normal Distributions. For each of the data sets in...Ch. 5.1 - Body Temperature. Figure 5.8 shows a histogram for...Ch. 5.1 - Cotinine. The amount of nicotine absorbed by the...Ch. 5.1 - Departure Delay Times. Figure 5.10 on the next...Ch. 5.1 - MM Weights. Figure 5.11 shows a histogram for the...Ch. 5.1 - Areas and Relative Frequencies. Consider the graph...Ch. 5.1 - Areas and Relative Frequencies. Consider the graph...Ch. 5.1 - Estimating Areas. Consider the graph of the normal...Ch. 5.1 - Prob. 26ECh. 5.2 - The 68-95-99.7 Rule. What is the 68-95-99.7 rule...Ch. 5.2 - Applying the 68-95-99.7 Rule. For a normal...Ch. 5.2 - Standard Score. What is a standard score? How do...Ch. 5.2 - Percentiles. What is a percentile? Describe how...Ch. 5.2 - Does It Make Sense? For Exercises 58, determine...Ch. 5.2 - Does It Make Sense? For Exercises 58, determine...Ch. 5.2 - Does It Make Sense? For Exercises 58, determine...Ch. 5.2 - Does It Make Sense? For Exercises 58, determine...Ch. 5.2 - Using the 68-95-99.7 Rule. A test of depth...Ch. 5.2 - Using the 68-95-99.7 Rule. Pulse rates for adult...Ch. 5.2 - Applying the 68-95-99.7 Rule. In a study of facial...Ch. 5.2 - Applying the 68-95-99.7 Rule. Adult males have...Ch. 5.2 - IQ Scores. For Exercises 1324, sketch the normal...Ch. 5.2 - IQ Scores. For Exercises 1324, sketch the normal...Ch. 5.2 - IQ Scores. For Exercises 1324, sketch the normal...Ch. 5.2 - IQ Scores. For Exercises 1324, sketch the normal...Ch. 5.2 - IQ Scores. For Exercises 1324, sketch the normal...Ch. 5.2 - IQ Scores. For Exercises 1324, sketch the normal...Ch. 5.2 - IQ Scores. For Exercises 1324, sketch the normal...Ch. 5.2 - Prob. 20ECh. 5.2 - Prob. 21ECh. 5.2 - Prob. 22ECh. 5.2 - Prob. 23ECh. 5.2 - IQ Scores. For Exercises 1324, sketch the normal...Ch. 5.2 - Heights of Males. For Exercises 2536, sketch the...Ch. 5.2 - Heights of Males. For Exercises 2536, sketch the...Ch. 5.2 - Heights of Males. For Exercises 2536, sketch the...Ch. 5.2 - Heights of Males. For Exercises 2536, sketch the...Ch. 5.2 - Heights of Males. For Exercises 2536, sketch the...Ch. 5.2 - Heights of Males. For Exercises 2536, sketch the...Ch. 5.2 - Heights of Males. For Exercises 2536, sketch the...Ch. 5.2 - Heights of Males. For Exercises 2536, sketch the...Ch. 5.2 - Heights of Males. For Exercises 2536, sketch the...Ch. 5.2 - Heights of Males. For Exercises 2536, sketch the...Ch. 5.2 - Heights of Males. For Exercises 2536, sketch the...Ch. 5.2 - Heights of Males. For Exercises 2536, sketch the...Ch. 5.2 - Coin Weights. Consider the following table,...Ch. 5.2 - Pregnancy Lengths. Lengths of pregnancies are...Ch. 5.2 - SAT Scores. Based on data from the College Board,...Ch. 5.2 - GRE Scores. Assume that the scores on the Graduate...Ch. 5.2 - Body Temperatures. Assume that body temperatures...Ch. 5.2 - Spelling Bee Scores. At the district spelling bee,...Ch. 5.2 - Being a Marine. Heights of adult American males...Ch. 5.2 - Prob. 44ECh. 5.3 - Distribution of Means. What is a distribution of...Ch. 5.3 - Notation. This section includes formulas using the...Ch. 5.3 - Central Limit Theorem. What is the Central Limit...Ch. 5.3 - Central Limit Theorem. Briefly explain a major...Ch. 5.3 - Prob. 5ECh. 5.3 - Does It Make Sense? For Exercises 58, determine...Ch. 5.3 - Does It Make Sense? For Exercises 58, determine...Ch. 5.3 - Prob. 8ECh. 5.3 - Prob. 9ECh. 5.3 - Weights. Weights of adult males are normally...Ch. 5.3 - Twelve-Sided Dice and the Central Limit Theorem....Ch. 5.3 - Ten-Sided Dice and the Central Limit Theorem....Ch. 5.3 - Weights. In Exercises 1316, assume that weights of...Ch. 5.3 - Weights. In Exercises 1316, assume that weights of...Ch. 5.3 - Weights. In Exercises 1316, assume that weights of...Ch. 5.3 - Weights. In Exercises 1316, assume that weights of...Ch. 5.3 - Amounts of Cola. Assume that cans of cola are...Ch. 5.3 - Designing Strobe Lights. An aircraft strobe light...Ch. 5.3 - Designing Motorcycle Helmets. Engineers must...Ch. 5.3 - Redesign of Ejection Seats. When women first...Ch. 5.3 - Prob. 21ECh. 5.3 - Vending Machines. Currently, quarters have weights...Ch. 5.3 - Aircraft Safety Standards. Federal Aviation...Ch. 5.3 - Prob. 24ECh. 5 - For each of the following situations, state...Ch. 5 - Women have head circumferences that are normally...Ch. 5 - Assume that body temperatures of healthy adults...Ch. 5 - Which of the following statements are correct? a....Ch. 5 - Which of the following is likely to have a...Ch. 5 - Pulse Rates. In Exercises 310, assume that pulse...Ch. 5 - Pulse Rates. In Exercises 310, assume that pulse...Ch. 5 - Pulse Rates. In Exercises 310, assume that pulse...Ch. 5 - Pulse Rates. In Exercises 310, assume that pulse...Ch. 5 - Pulse Rates. In Exercises 310, assume that pulse...Ch. 5 - Pulse Rates. In Exercises 310, assume that pulse...Ch. 5 - Pulse Rates. In Exercises 310, assume that pulse...Ch. 5 - Pulse Rates. In Exercises 310, assume that pulse...
Knowledge Booster


Learn more about
Need a deep-dive on the concept behind this application? Look no further. Learn more about this topic, statistics and related others by exploring similar questions and additional content below.Similar questions
- 9. The concentration function of a random variable X is defined as Qx(h) = sup P(x ≤ X ≤x+h), h>0. Show that, if X and Y are independent random variables, then Qx+y (h) min{Qx(h). Qr (h)).arrow_forward10. Prove that, if (t)=1+0(12) as asf->> O is a characteristic function, then p = 1.arrow_forward9. The concentration function of a random variable X is defined as Qx(h) sup P(x ≤x≤x+h), h>0. (b) Is it true that Qx(ah) =aQx (h)?arrow_forward
- 3. Let X1, X2,..., X, be independent, Exp(1)-distributed random variables, and set V₁₁ = max Xk and W₁ = X₁+x+x+ Isk≤narrow_forward7. Consider the function (t)=(1+|t|)e, ER. (a) Prove that is a characteristic function. (b) Prove that the corresponding distribution is absolutely continuous. (c) Prove, departing from itself, that the distribution has finite mean and variance. (d) Prove, without computation, that the mean equals 0. (e) Compute the density.arrow_forward1. Show, by using characteristic, or moment generating functions, that if fx(x) = ½ex, -∞0 < x < ∞, then XY₁ - Y2, where Y₁ and Y2 are independent, exponentially distributed random variables.arrow_forward
- 1. Show, by using characteristic, or moment generating functions, that if 1 fx(x): x) = ½exarrow_forward1990) 02-02 50% mesob berceus +7 What's the probability of getting more than 1 head on 10 flips of a fair coin?arrow_forward9. The concentration function of a random variable X is defined as Qx(h) sup P(x≤x≤x+h), h>0. = x (a) Show that Qx+b(h) = Qx(h).arrow_forward
- Suppose that you buy a lottery ticket, and you have to pick six numbers from 1 through 50 (repetitions allowed). Which combination is more likely to win: 13, 48, 17, 22, 6, 39 or 1, 2, 3, 4, 5, 6? barrow_forward2 Make a histogram from this data set of test scores: 72, 79, 81, 80, 63, 62, 89, 99, 50, 78, 87, 97, 55, 69, 97, 87, 88, 99, 76, 78, 65, 77, 88, 90, and 81. Would a pie chart be appropriate for this data? ganizing Quantitative Data: Charts and Graphs 45arrow_forward10 Meteorologists use computer models to predict when and where a hurricane will hit shore. Suppose they predict that hurricane Stat has a 20 percent chance of hitting the East Coast. a. On what info are the meteorologists basing this prediction? b. Why is this prediction harder to make than your chance of getting a head on your next coin toss? U anoiaarrow_forward
arrow_back_ios
SEE MORE QUESTIONS
arrow_forward_ios
Recommended textbooks for you
 Big Ideas Math A Bridge To Success Algebra 1: Stu...AlgebraISBN:9781680331141Author:HOUGHTON MIFFLIN HARCOURTPublisher:Houghton Mifflin Harcourt
 Glencoe Algebra 1, Student Edition, 9780079039897...AlgebraISBN:9780079039897Author:CarterPublisher:McGraw Hill
 Holt Mcdougal Larson Pre-algebra: Student Edition...AlgebraISBN:9780547587776Author:HOLT MCDOUGALPublisher:HOLT MCDOUGAL
 Algebra: Structure And Method, Book 1AlgebraISBN:9780395977224Author:Richard G. Brown, Mary P. Dolciani, Robert H. Sorgenfrey, William L. ColePublisher:McDougal Littell
Big Ideas Math A Bridge To Success Algebra 1: Stu...
Algebra
ISBN:9781680331141
Author:HOUGHTON MIFFLIN HARCOURT
Publisher:Houghton Mifflin Harcourt
Glencoe Algebra 1, Student Edition, 9780079039897...
Algebra
ISBN:9780079039897
Author:Carter
Publisher:McGraw Hill
Holt Mcdougal Larson Pre-algebra: Student Edition...
Algebra
ISBN:9780547587776
Author:HOLT MCDOUGAL
Publisher:HOLT MCDOUGAL
Algebra: Structure And Method, Book 1
Algebra
ISBN:9780395977224
Author:Richard G. Brown, Mary P. Dolciani, Robert H. Sorgenfrey, William L. Cole
Publisher:McDougal Littell
Continuous Probability Distributions - Basic Introduction; Author: The Organic Chemistry Tutor;https://www.youtube.com/watch?v=QxqxdQ_g2uw;License: Standard YouTube License, CC-BY
Probability Density Function (p.d.f.) Finding k (Part 1) | ExamSolutions; Author: ExamSolutions;https://www.youtube.com/watch?v=RsuS2ehsTDM;License: Standard YouTube License, CC-BY
Find the value of k so that the Function is a Probability Density Function; Author: The Math Sorcerer;https://www.youtube.com/watch?v=QqoCZWrVnbA;License: Standard Youtube License