Likely to Become Rich? A Gallup poll conducted in 2012 asked people who were not rich whether they thought it was likely that they would become rich. The table gives the total number of people in each age range (rounded) and the percent who said they were likely to become rich. a. Make a two-way table for counts (not percentages). The table is started below. b. What is the tendency? Which group was most likely to think they might become rich, and which group was least likely to think they might become rich? Does this make sense to you? c. From your table, if one person is selected from the table, what is the probability that this person is young (18-29) AND thinks it is likely that she of he will become rich. d. If you select a person from the people who think it is likely that she or he will become rich, what is the probability that this person is young (18-29)? e. If you select a young person (18-29), what is the probability that this person thinks it is likely they she or he will become rich? f. Why is the probability in part c smaller than those in parts d and e?
Likely to Become Rich? A Gallup poll conducted in 2012 asked people who were not rich whether they thought it was likely that they would become rich. The table gives the total number of people in each age range (rounded) and the percent who said they were likely to become rich. a. Make a two-way table for counts (not percentages). The table is started below. b. What is the tendency? Which group was most likely to think they might become rich, and which group was least likely to think they might become rich? Does this make sense to you? c. From your table, if one person is selected from the table, what is the probability that this person is young (18-29) AND thinks it is likely that she of he will become rich. d. If you select a person from the people who think it is likely that she or he will become rich, what is the probability that this person is young (18-29)? e. If you select a young person (18-29), what is the probability that this person thinks it is likely they she or he will become rich? f. Why is the probability in part c smaller than those in parts d and e?
Solution Summary: The author explains that the Gallup Poll is conducted on a sample of people who were not rich in order to determine their thoughts on the likelihood of becoming rich.
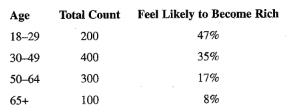
Likely to Become Rich? A Gallup poll conducted in 2012 asked people who were not rich whether they thought it was likely that they would become rich. The table gives the total number of people in each age range (rounded) and the percent who said they were likely to become rich.
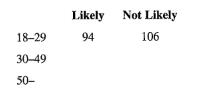
a. Make a two-way table for counts (not percentages). The table is started below.
b. What is the tendency? Which group was most likely to think they might become rich, and which group was least likely to think they might become rich? Does this make sense to you?
c. From your table, if one person is selected from the table, what is the probability that this person is young (18-29) AND thinks it is likely that she of he will become rich.
d. If you select a person from the people who think it is likely that she or he will become rich, what is the probability that this person is young (18-29)?
e. If you select a young person (18-29), what is the probability that this person thinks it is likely they she or he will become rich?
f. Why is the probability in part c smaller than those in parts d and e?
Techniques QUAT6221 2025 PT B...
TM
Tabudi Maphoru
Activities Assessments Class Progress lIE Library • Help v
The table below shows the prices (R) and quantities (kg) of rice, meat and potatoes items bought during 2013 and 2014:
2013
2014
P1Qo
PoQo
Q1Po P1Q1
Price
Ро
Quantity
Qo
Price
P1
Quantity
Q1
Rice
7
80
6
70
480
560
490
420
Meat
30
50
35
60
1 750
1 500
1 800
2 100
Potatoes
3
100
3
100
300
300
300
300
TOTAL
40
230
44
230
2 530
2 360
2 590
2 820
Instructions:
1 Corall dawn to tha bottom of thir ceraan urina se se tha haca nariad in archerca antarand cubmit
Q Search
ENG US
口X
2025/05
The table below indicates the number of years of experience of a sample of employees who work on a particular production line and the corresponding number of units of a good that each employee produced last month.
Years of Experience (x)
Number of Goods (y)
11
63
5
57
1
48
4
54
45
3
51
Q.1.1 By completing the table below and then applying the relevant formulae, determine the line of best fit for this bivariate data set.
Do NOT change the units for the variables.
X
y
X2
xy
Ex=
Ey=
EX2
EXY=
Q.1.2 Estimate the number of units of the good that would have been produced last month by an employee with 8 years of experience.
Q.1.3 Using your calculator, determine the coefficient of correlation for the data set.
Interpret your answer.
Q.1.4 Compute the coefficient of determination for the data set.
Interpret your answer.
Elementary Statistics: Picturing the World (7th Edition)
Knowledge Booster
Learn more about
Need a deep-dive on the concept behind this application? Look no further. Learn more about this topic, statistics and related others by exploring similar questions and additional content below.


 Holt Mcdougal Larson Pre-algebra: Student Edition...AlgebraISBN:9780547587776Author:HOLT MCDOUGALPublisher:HOLT MCDOUGAL
 Big Ideas Math A Bridge To Success Algebra 1: Stu...AlgebraISBN:9781680331141Author:HOUGHTON MIFFLIN HARCOURTPublisher:Houghton Mifflin Harcourt
 Glencoe Algebra 1, Student Edition, 9780079039897...AlgebraISBN:9780079039897Author:CarterPublisher:McGraw Hill