Four Children (Example 3) The sample space given here shows all possible sequences for a family with 4 children, where B stands for boy and G stands for girl. Assume that all of the 16 outcomes are equally likely. Find the probability of having the following numbers of girls out of 4 children: (a) exactly 0 girls, (b) exactly I girl, (c) exactly 2 girls, (d) exactly 3 girls, (e) exactly 4 girls. (Hint: The probability of having 3 girls and a boy is 4 16 , or 25 % , because the second column shows that there are 4 ways to have 3 girls and 1 boy.)
Four Children (Example 3) The sample space given here shows all possible sequences for a family with 4 children, where B stands for boy and G stands for girl. Assume that all of the 16 outcomes are equally likely. Find the probability of having the following numbers of girls out of 4 children: (a) exactly 0 girls, (b) exactly I girl, (c) exactly 2 girls, (d) exactly 3 girls, (e) exactly 4 girls. (Hint: The probability of having 3 girls and a boy is 4 16 , or 25 % , because the second column shows that there are 4 ways to have 3 girls and 1 boy.)
Solution Summary: The author determines the probability of having the following number of girls in a family with 4 children. All possible sequences are given.
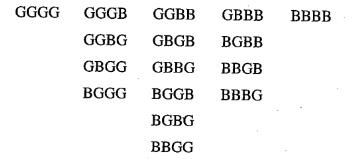
Four Children (Example 3) The sample space given here shows all possible sequences for a family with 4 children, where B stands for boy and G stands for girl.
Assume that all of the 16 outcomes are equally likely. Find the probability of having the following numbers of girls out of 4 children: (a) exactly 0 girls, (b) exactly I girl, (c) exactly 2 girls, (d) exactly 3 girls, (e) exactly 4 girls.
(Hint: The probability of having 3 girls and a boy is
4
16
, or
25
%
, because the second column shows that there are 4 ways to have 3 girls and 1 boy.)
Definition Definition For any random event or experiment, the set that is formed with all the possible outcomes is called a sample space. When any random event takes place that has multiple outcomes, the possible outcomes are grouped together in a set. The sample space can be anything, from a set of vectors to real numbers.
Techniques QUAT6221 2025 PT B...
TM
Tabudi Maphoru
Activities Assessments Class Progress lIE Library • Help v
The table below shows the prices (R) and quantities (kg) of rice, meat and potatoes items bought during 2013 and 2014:
2013
2014
P1Qo
PoQo
Q1Po P1Q1
Price
Ро
Quantity
Qo
Price
P1
Quantity
Q1
Rice
7
80
6
70
480
560
490
420
Meat
30
50
35
60
1 750
1 500
1 800
2 100
Potatoes
3
100
3
100
300
300
300
300
TOTAL
40
230
44
230
2 530
2 360
2 590
2 820
Instructions:
1 Corall dawn to tha bottom of thir ceraan urina se se tha haca nariad in archerca antarand cubmit
Q Search
ENG US
口X
2025/05
The table below indicates the number of years of experience of a sample of employees who work on a particular production line and the corresponding number of units of a good that each employee produced last month.
Years of Experience (x)
Number of Goods (y)
11
63
5
57
1
48
4
54
45
3
51
Q.1.1 By completing the table below and then applying the relevant formulae, determine the line of best fit for this bivariate data set.
Do NOT change the units for the variables.
X
y
X2
xy
Ex=
Ey=
EX2
EXY=
Q.1.2 Estimate the number of units of the good that would have been produced last month by an employee with 8 years of experience.
Q.1.3 Using your calculator, determine the coefficient of correlation for the data set.
Interpret your answer.
Q.1.4 Compute the coefficient of determination for the data set.
Interpret your answer.
Finite Mathematics for Business, Economics, Life Sciences and Social Sciences
Knowledge Booster
Learn more about
Need a deep-dive on the concept behind this application? Look no further. Learn more about this topic, statistics and related others by exploring similar questions and additional content below.
Probability & Statistics (28 of 62) Basic Definitions and Symbols Summarized; Author: Michel van Biezen;https://www.youtube.com/watch?v=21V9WBJLAL8;License: Standard YouTube License, CC-BY
Introduction to Probability, Basic Overview - Sample Space, & Tree Diagrams; Author: The Organic Chemistry Tutor;https://www.youtube.com/watch?v=SkidyDQuupA;License: Standard YouTube License, CC-BY


 College Algebra (MindTap Course List)AlgebraISBN:9781305652231Author:R. David Gustafson, Jeff HughesPublisher:Cengage Learning
 Holt Mcdougal Larson Pre-algebra: Student Edition...AlgebraISBN:9780547587776Author:HOLT MCDOUGALPublisher:HOLT MCDOUGAL
 Glencoe Algebra 1, Student Edition, 9780079039897...AlgebraISBN:9780079039897Author:CarterPublisher:McGraw Hill
 College AlgebraAlgebraISBN:9781305115545Author:James Stewart, Lothar Redlin, Saleem WatsonPublisher:Cengage Learning