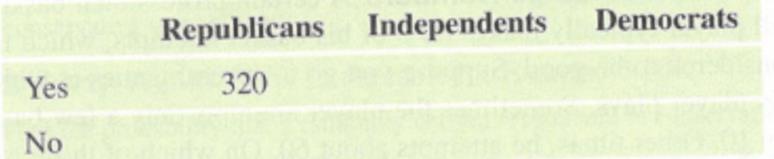
Benefits from Rich A Gallup poll conducted in 2012 asked people, "Do you think the United States benefits from having a class of rich people?" In response, 80 % of Republicans, 59 % of Independents, and 52 % of Democrats said Yes. Assume that any-one who did not answer Yes answered No. Suppose the number of Republicans polled was 400, the number of Democrats was 500, and the number of Independents was 100. a. Create a two-way table with counts (not percentage) that starts as shown here. b. What is the probability that a person randomly selected is a Democrat given they said Yes? c. What is the probability that a person randomly selected is a Republican given they said Yes.? d. What is the probability that a person randomly selected said Yes given they are a Democrat? e. What is the probability that a person randomly selected from the entire group is a Democrat AND said Yes?
Benefits from Rich A Gallup poll conducted in 2012 asked people, "Do you think the United States benefits from having a class of rich people?" In response, 80 % of Republicans, 59 % of Independents, and 52 % of Democrats said Yes. Assume that any-one who did not answer Yes answered No. Suppose the number of Republicans polled was 400, the number of Democrats was 500, and the number of Independents was 100. a. Create a two-way table with counts (not percentage) that starts as shown here. b. What is the probability that a person randomly selected is a Democrat given they said Yes? c. What is the probability that a person randomly selected is a Republican given they said Yes.? d. What is the probability that a person randomly selected said Yes given they are a Democrat? e. What is the probability that a person randomly selected from the entire group is a Democrat AND said Yes?
Solution Summary: The two-way table summarizes the statistics of republicans, democrats, and independents in the Gallup poll.
Benefits from Rich A Gallup poll conducted in 2012 asked people, "Do you think the United States benefits from having a class of rich people?" In response,
80
%
of Republicans,
59
%
of Independents, and
52
%
of Democrats said Yes. Assume that any-one who did not answer Yes answered No. Suppose the number of Republicans polled was 400, the number of Democrats was 500, and the number of Independents was 100.
a. Create a two-way table with counts (not percentage) that starts as shown here.
b. What is the probability that a person randomly selected is a Democrat given they said Yes?
c. What is the probability that a person randomly selected is a Republican given they said Yes.?
d. What is the probability that a person randomly selected said Yes given they are a Democrat?
e. What is the probability that a person randomly selected from the entire group is a Democrat AND said Yes?
Find the critical value for a left-tailed test using the F distribution with a 0.025, degrees of freedom in the numerator=12, and degrees of freedom in the
denominator = 50. A portion of the table of critical values of the F-distribution is provided.
Click the icon to view the partial table of critical values of the F-distribution.
What is the critical value?
(Round to two decimal places as needed.)
A retail store manager claims that the average daily sales of the store are $1,500.
You aim to test whether the actual average daily sales differ significantly from this claimed value.
You can provide your answer by inserting a text box and the answer must include:
Null hypothesis,
Alternative hypothesis,
Show answer (output table/summary table), and
Conclusion based on the P value.
Showing the calculation is a must. If calculation is missing,so please provide a step by step on the answers
Numerical answers in the yellow cells
Need a deep-dive on the concept behind this application? Look no further. Learn more about this topic, statistics and related others by exploring similar questions and additional content below.


 Holt Mcdougal Larson Pre-algebra: Student Edition...AlgebraISBN:9780547587776Author:HOLT MCDOUGALPublisher:HOLT MCDOUGAL
 Glencoe Algebra 1, Student Edition, 9780079039897...AlgebraISBN:9780079039897Author:CarterPublisher:McGraw Hill
 Functions and Change: A Modeling Approach to Coll...AlgebraISBN:9781337111348Author:Bruce Crauder, Benny Evans, Alan NoellPublisher:Cengage Learning
 Big Ideas Math A Bridge To Success Algebra 1: Stu...AlgebraISBN:9781680331141Author:HOUGHTON MIFFLIN HARCOURTPublisher:Houghton Mifflin Harcourt
