
Introductory Statistics
1st Edition
ISBN: 9781938168208
Author: Barbara Illowsky, Susan Dean
Publisher: OpenStax College
expand_more
expand_more
format_list_bulleted
Videos
Textbook Question
Chapter 5, Problem 5P
What does the shaded area represent? P(______
Figure 5.41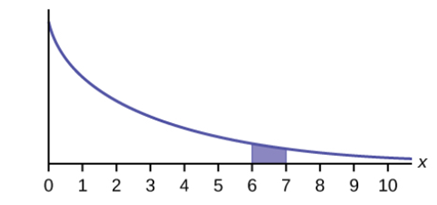
Expert Solution & Answer
Want to see the full answer?
Check out a sample textbook solution
Students have asked these similar questions
Analyze the residuals of a linear regression model and select the best response.
yes, the residual plot does not show a curve
no, the residual plot shows a curve
yes, the residual plot shows a curve
no, the residual plot does not show a curve
I answered, "No, the residual plot shows a curve." (and this was incorrect). I am not sure why I keep getting these wrong when the answer seems obvious. Please help me understand what the yes and no references in the answer.
a. Find the value of A.b. Find pX(x) and py(y).c. Find pX|y(x|y) and py|X(y|x)d. Are x and y independent? Why or why not?
Analyze the residuals of a linear regression model and select the best response.Criteria is simple evaluation of possible indications of an exponential model vs. linear model)
no, the residual plot does not show a curve
yes, the residual plot does not show a curve
yes, the residual plot shows a curve
no, the residual plot shows a curve
I selected:
yes, the residual plot shows a curve and it is INCORRECT. Can u help me understand why?
Chapter 5 Solutions
Introductory Statistics
Ch. 5 - Consider the function f(x)=18 for 0x8 0. Draw the...Ch. 5 - The data the follow are the number of passengers...Ch. 5 - A distribution is given as X ~U(0, 20). What is...Ch. 5 - The total duration of baseball games in the major...Ch. 5 - Suppose the time it takes a student to finish a...Ch. 5 - The amount of time a service technician needs to...Ch. 5 - The amount of time spouses shop for anniversary...Ch. 5 - The number of days ahead travelers purchase their...Ch. 5 - On average, a pair of running shoes can last 18...Ch. 5 - Suppose that the distance, in miles, that people...
Ch. 5 - Suppose that on a certain stretch of highway, cars...Ch. 5 - Suppose that the longevity of a light bulb is...Ch. 5 - In a small city the number of automobile accidents...Ch. 5 - Which type of distribution does the graph...Ch. 5 - Which type of distribution does the graph...Ch. 5 - Which type of distribution does the graph...Ch. 5 - What does the shaded area represent? P(_< x <_)...Ch. 5 - What does the shaded area represent? P(______...Ch. 5 - For a continuous probablity distribution, 0x15 ....Ch. 5 - What is the area under f(x) if the function is a...Ch. 5 - For a continuous probability distribution, 0x10 ....Ch. 5 - A continuous probability function is restricted to...Ch. 5 - f(x) for a continuous probability function is 15 ,...Ch. 5 - f(x) , a continuous probability function, is equal...Ch. 5 - Find the probability that x falls in the shaded...Ch. 5 - Find the probability that x falls in the shaded...Ch. 5 - Find the probability that x falls in the shaded...Ch. 5 - m:math display='block'>f(x), a continuous...Ch. 5 - Use the following information to answer the next...Ch. 5 - Use the following information to answer the next...Ch. 5 - Use the following information to answer the next...Ch. 5 - Use the following information to answer the next...Ch. 5 - Use the following information to answer the next...Ch. 5 - Use the following information to answer the next...Ch. 5 - the following information to answer the next ten...Ch. 5 - Use the following information to answer the next...Ch. 5 - Use the following information to answer the next...Ch. 5 - Use the following information to answer the next...Ch. 5 - Use the following information to answer the next...Ch. 5 - Use the following information to answer the next...Ch. 5 - Use the following information to answer the next...Ch. 5 - Use the following information to answer the next...Ch. 5 - Use the following information to answer the next...Ch. 5 - Use the following information to answer the next...Ch. 5 - Use the following information to answer the next...Ch. 5 - Use the following information to answer the next...Ch. 5 - Use the following information to answer the next...Ch. 5 - Use the following information to answer the next...Ch. 5 - Use the following information to answer the next...Ch. 5 - Use the following information to answer the next...Ch. 5 - Use the following information to answer the next...Ch. 5 - Use the following information to answer the next...Ch. 5 - Use the following information to answer the next...Ch. 5 - Use the following information to answer the next...Ch. 5 - Use the following information to answer the next...Ch. 5 - Use the following information to answer the next...Ch. 5 - Use the following information to answer the next...Ch. 5 - Find the third quartile of ages of cars In the...Ch. 5 - Use the following information to answer the next...Ch. 5 - Use the following information to answer the next...Ch. 5 - Use the following information to answer the next...Ch. 5 - Use the following information to answer the next...Ch. 5 - Use the following information to answer the next...Ch. 5 - Use the following information to answer the next...Ch. 5 - Use the following information to answer the next...Ch. 5 - Use the following information to answer the next...Ch. 5 - Use the following information to answer the next...Ch. 5 - Use the following information to answer the next...Ch. 5 - Use the following information to answer the next...Ch. 5 - Use the following information to answer the next...Ch. 5 - Use the following information to answer the next...Ch. 5 - Use the following information to answer the next...Ch. 5 - Use the following information to answer the next...Ch. 5 - Use the following information to answer the next...Ch. 5 - Use the following information to answer the next...Ch. 5 - Use the following information to answer the next...Ch. 5 - Use the following information to answer the next...Ch. 5 - Use the following information to answer the next...Ch. 5 - Use the following information to answer the next...Ch. 5 - Use the following information to answer the next...Ch. 5 - Use the following information to answer the next...Ch. 5 - Use the following information to answer the net 16...Ch. 5 - Use the following information to answer the net 16...Ch. 5 - Use the following information to answer the net 16...Ch. 5 - For each probability and percentile problem, draw...Ch. 5 - For each probability and percentile problem, draw...Ch. 5 - For each probability and percentile problem, draw...Ch. 5 - For each probability and percentile problem, draw...Ch. 5 - For each probability and percentile problem, draw...Ch. 5 - For each probability and percentile problem, draw...Ch. 5 - For each probability and percentile problem, draw...Ch. 5 - Use the following information o answer the next...Ch. 5 - Use the following information o answer the next...Ch. 5 - Use the following information o answer the next...Ch. 5 - The time (In minutes) until the next bus departs a...Ch. 5 - Suppose that the value of a stock varies each day...Ch. 5 - A fireworks show is designed so that the time...Ch. 5 - The number of miles driven by a truck driver falls...Ch. 5 - Suppose that the length of long distance phone...Ch. 5 - Suppose that the useful life of a particular car...Ch. 5 - The percent of persons (ages five and older) in...Ch. 5 - The time (In years) after reaching age 60 that ft...Ch. 5 - The cost of all maintenance for a car during fts...Ch. 5 - Use the following information to answer the next...Ch. 5 - Use the following information to answer the next...Ch. 5 - Use the following information to answer the next...Ch. 5 - Let X ~ Exp(0.l). a. decay rate = _________ b. ...Ch. 5 - Suppose that the longevity of a light bulb is...Ch. 5 - At a 911 call center, calls come in a an average...Ch. 5 - In major league baseball, a no-hitter is a game in...Ch. 5 - During the years 1998—2012. a total of 29...Ch. 5 - According to the American Red Cross. about one out...Ch. 5 - A web site experiences traffic during normal...Ch. 5 - At an urgent care faci11t; patients arrive at an...
Additional Math Textbook Solutions
Find more solutions based on key concepts
In hypothesis testing, the common level of significance is =0.05. Some might argue for a level of significance ...
Basic Business Statistics, Student Value Edition
Chain Rule using a table Let h(x)= f(g(x)) and p(x) = g(f(x)). Use the table to compute the following derivativ...
Calculus: Early Transcendentals (2nd Edition)
TRY IT YOURSELF 1
Find the mean of the points scored by the 51 winning teams listed on page 39.
Elementary Statistics: Picturing the World (7th Edition)
In Exercises 9-22, change the Cartesian integral into an equivalent polar integral. Then evaluate the polar int...
University Calculus: Early Transcendentals (4th Edition)
7. Body Temperature Example 5 in Section 8-3 involved a test of the claim that humans have body temperatures wi...
Elementary Statistics (13th Edition)
Knowledge Booster


Learn more about
Need a deep-dive on the concept behind this application? Look no further. Learn more about this topic, statistics and related others by exploring similar questions and additional content below.Similar questions
- You have been hired as an intern to run analyses on the data and report the results back to Sarah; the five questions that Sarah needs you to address are given below. please do it step by step on excel Does there appear to be a positive or negative relationship between price and screen size? Use a scatter plot to examine the relationship. Determine and interpret the correlation coefficient between the two variables. In your interpretation, discuss the direction of the relationship (positive, negative, or zero relationship). Also discuss the strength of the relationship. Estimate the relationship between screen size and price using a simple linear regression model and interpret the estimated coefficients. (In your interpretation, tell the dollar amount by which price will change for each unit of increase in screen size). Include the manufacturer dummy variable (Samsung=1, 0 otherwise) and estimate the relationship between screen size, price and manufacturer dummy as a multiple…arrow_forwardHere is data with as the response variable. x y54.4 19.124.9 99.334.5 9.476.6 0.359.4 4.554.4 0.139.2 56.354 15.773.8 9-156.1 319.2Make a scatter plot of this data. Which point is an outlier? Enter as an ordered pair, e.g., (x,y). (x,y)= Find the regression equation for the data set without the outlier. Enter the equation of the form mx+b rounded to three decimal places. y_wo= Find the regression equation for the data set with the outlier. Enter the equation of the form mx+b rounded to three decimal places. y_w=arrow_forwardYou have been hired as an intern to run analyses on the data and report the results back to Sarah; the five questions that Sarah needs you to address are given below. please do it step by step Does there appear to be a positive or negative relationship between price and screen size? Use a scatter plot to examine the relationship. Determine and interpret the correlation coefficient between the two variables. In your interpretation, discuss the direction of the relationship (positive, negative, or zero relationship). Also discuss the strength of the relationship. Estimate the relationship between screen size and price using a simple linear regression model and interpret the estimated coefficients. (In your interpretation, tell the dollar amount by which price will change for each unit of increase in screen size). Include the manufacturer dummy variable (Samsung=1, 0 otherwise) and estimate the relationship between screen size, price and manufacturer dummy as a multiple linear…arrow_forward
- Exercises: Find all the whole number solutions of the congruence equation. 1. 3x 8 mod 11 2. 2x+3= 8 mod 12 3. 3x+12= 7 mod 10 4. 4x+6= 5 mod 8 5. 5x+3= 8 mod 12arrow_forwardScenario Sales of products by color follow a peculiar, but predictable, pattern that determines how many units will sell in any given year. This pattern is shown below Product Color 1995 1996 1997 Red 28 42 21 1998 23 1999 29 2000 2001 2002 Unit Sales 2003 2004 15 8 4 2 1 2005 2006 discontinued Green 26 39 20 22 28 14 7 4 2 White 43 65 33 36 45 23 12 Brown 58 87 44 48 60 Yellow 37 56 28 31 Black 28 42 21 Orange 19 29 Purple Total 28 42 21 49 68 78 95 123 176 181 164 127 24 179 Questions A) Which color will sell the most units in 2007? B) Which color will sell the most units combined in the 2007 to 2009 period? Please show all your analysis, leave formulas in cells, and specify any assumptions you make.arrow_forwardOne hundred students were surveyed about their preference between dogs and cats. The following two-way table displays data for the sample of students who responded to the survey. Preference Male Female TOTAL Prefers dogs \[36\] \[20\] \[56\] Prefers cats \[10\] \[26\] \[36\] No preference \[2\] \[6\] \[8\] TOTAL \[48\] \[52\] \[100\] problem 1 Find the probability that a randomly selected student prefers dogs.Enter your answer as a fraction or decimal. \[P\left(\text{prefers dogs}\right)=\] Incorrect Check Hide explanation Preference Male Female TOTAL Prefers dogs \[\blueD{36}\] \[\blueD{20}\] \[\blueE{56}\] Prefers cats \[10\] \[26\] \[36\] No preference \[2\] \[6\] \[8\] TOTAL \[48\] \[52\] \[100\] There were \[\blueE{56}\] students in the sample who preferred dogs out of \[100\] total students.arrow_forward
- Business discussarrow_forwardYou have been hired as an intern to run analyses on the data and report the results back to Sarah; the five questions that Sarah needs you to address are given below. Does there appear to be a positive or negative relationship between price and screen size? Use a scatter plot to examine the relationship. Determine and interpret the correlation coefficient between the two variables. In your interpretation, discuss the direction of the relationship (positive, negative, or zero relationship). Also discuss the strength of the relationship. Estimate the relationship between screen size and price using a simple linear regression model and interpret the estimated coefficients. (In your interpretation, tell the dollar amount by which price will change for each unit of increase in screen size). Include the manufacturer dummy variable (Samsung=1, 0 otherwise) and estimate the relationship between screen size, price and manufacturer dummy as a multiple linear regression model. Interpret the…arrow_forwardDoes there appear to be a positive or negative relationship between price and screen size? Use a scatter plot to examine the relationship. How to take snapshots: if you use a MacBook, press Command+ Shift+4 to take snapshots. If you are using Windows, use the Snipping Tool to take snapshots. Question 1: Determine and interpret the correlation coefficient between the two variables. In your interpretation, discuss the direction of the relationship (positive, negative, or zero relationship). Also discuss the strength of the relationship. Value of correlation coefficient: Direction of the relationship (positive, negative, or zero relationship): Strength of the relationship (strong/moderate/weak): Question 2: Estimate the relationship between screen size and price using a simple linear regression model and interpret the estimated coefficients. In your interpretation, tell the dollar amount by which price will change for each unit of increase in screen size. (The answer for the…arrow_forward
- In this problem, we consider a Brownian motion (W+) t≥0. We consider a stock model (St)t>0 given (under the measure P) by d.St 0.03 St dt + 0.2 St dwt, with So 2. We assume that the interest rate is r = 0.06. The purpose of this problem is to price an option on this stock (which we name cubic put). This option is European-type, with maturity 3 months (i.e. T = 0.25 years), and payoff given by F = (8-5)+ (a) Write the Stochastic Differential Equation satisfied by (St) under the risk-neutral measure Q. (You don't need to prove it, simply give the answer.) (b) Give the price of a regular European put on (St) with maturity 3 months and strike K = 2. (c) Let X = S. Find the Stochastic Differential Equation satisfied by the process (Xt) under the measure Q. (d) Find an explicit expression for X₁ = S3 under measure Q. (e) Using the results above, find the price of the cubic put option mentioned above. (f) Is the price in (e) the same as in question (b)? (Explain why.)arrow_forwardProblem 4. Margrabe formula and the Greeks (20 pts) In the homework, we determined the Margrabe formula for the price of an option allowing you to swap an x-stock for a y-stock at time T. For stocks with initial values xo, yo, common volatility σ and correlation p, the formula was given by Fo=yo (d+)-x0Þ(d_), where In (±² Ꭲ d+ õ√T and σ = σ√√√2(1 - p). дго (a) We want to determine a "Greek" for ỡ on the option: find a formula for θα (b) Is дго θα positive or negative? (c) We consider a situation in which the correlation p between the two stocks increases: what can you say about the price Fo? (d) Assume that yo< xo and p = 1. What is the price of the option?arrow_forwardWe consider a 4-dimensional stock price model given (under P) by dẴ₁ = µ· Xt dt + йt · ΣdŴt where (W) is an n-dimensional Brownian motion, π = (0.02, 0.01, -0.02, 0.05), 0.2 0 0 0 0.3 0.4 0 0 Σ= -0.1 -4a За 0 0.2 0.4 -0.1 0.2) and a E R. We assume that ☑0 = (1, 1, 1, 1) and that the interest rate on the market is r = 0.02. (a) Give a condition on a that would make stock #3 be the one with largest volatility. (b) Find the diversification coefficient for this portfolio as a function of a. (c) Determine the maximum diversification coefficient d that you could reach by varying the value of a? 2arrow_forward
arrow_back_ios
SEE MORE QUESTIONS
arrow_forward_ios
Recommended textbooks for you
 Glencoe Algebra 1, Student Edition, 9780079039897...AlgebraISBN:9780079039897Author:CarterPublisher:McGraw Hill
 Algebra & Trigonometry with Analytic GeometryAlgebraISBN:9781133382119Author:SwokowskiPublisher:Cengage
 Mathematics For Machine TechnologyAdvanced MathISBN:9781337798310Author:Peterson, John.Publisher:Cengage Learning,
 Holt Mcdougal Larson Pre-algebra: Student Edition...AlgebraISBN:9780547587776Author:HOLT MCDOUGALPublisher:HOLT MCDOUGAL
 Algebra and Trigonometry (MindTap Course List)AlgebraISBN:9781305071742Author:James Stewart, Lothar Redlin, Saleem WatsonPublisher:Cengage Learning
Glencoe Algebra 1, Student Edition, 9780079039897...
Algebra
ISBN:9780079039897
Author:Carter
Publisher:McGraw Hill
Algebra & Trigonometry with Analytic Geometry
Algebra
ISBN:9781133382119
Author:Swokowski
Publisher:Cengage
Mathematics For Machine Technology
Advanced Math
ISBN:9781337798310
Author:Peterson, John.
Publisher:Cengage Learning,
Holt Mcdougal Larson Pre-algebra: Student Edition...
Algebra
ISBN:9780547587776
Author:HOLT MCDOUGAL
Publisher:HOLT MCDOUGAL
Algebra and Trigonometry (MindTap Course List)
Algebra
ISBN:9781305071742
Author:James Stewart, Lothar Redlin, Saleem Watson
Publisher:Cengage Learning
An Introduction to Area | Teaching Maths | EasyTeaching; Author: EasyTeaching;https://www.youtube.com/watch?v=_uKKl8R1xBM;License: Standard YouTube License, CC-BY
Area of a Rectangle, Triangle, Circle & Sector, Trapezoid, Square, Parallelogram, Rhombus, Geometry; Author: The Organic Chemistry Tutor;https://www.youtube.com/watch?v=JnLDmw3bbuw;License: Standard YouTube License, CC-BY