
Introductory Statistics
1st Edition
ISBN: 9781938168208
Author: Barbara Illowsky, Susan Dean
Publisher: OpenStax College
expand_more
expand_more
format_list_bulleted
Videos
Textbook Question
Chapter 5, Problem 1P
Which type of distribution does the graph illustrate?
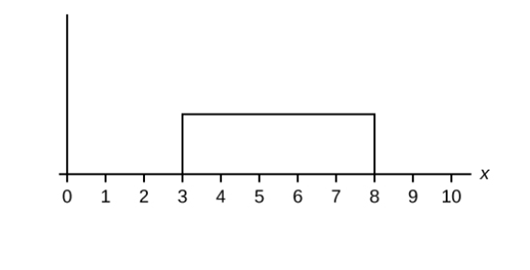
Figure 5.37
Expert Solution & Answer

Trending nowThis is a popular solution!

Students have asked these similar questions
A smallish urn contains 25 small plastic bunnies – 7 of which are pink and 18 of which are white. 10 bunnies are drawn from the urn at random with replacement, and X is the number of pink bunnies that are drawn.
(a) P(X = 5) ≈
(b) P(X<6) ≈
The Whoville small urn contains 100 marbles – 60 blue and 40 orange. The Grinch sneaks in one night and grabs a simple random sample (without replacement) of 15 marbles.
(a) The probability that the Grinch gets exactly 6 blue marbles is [ Select ] ["≈ 0.054", "≈ 0.043", "≈ 0.061"] .
(b) The probability that the Grinch gets at least 7 blue marbles is [ Select ] ["≈ 0.922", "≈ 0.905", "≈ 0.893"] .
(c) The probability that the Grinch gets between 8 and 12 blue marbles (inclusive) is [ Select ] ["≈ 0.801", "≈ 0.760", "≈ 0.786"] . The Whoville small urn contains 100 marbles – 60 blue and 40 orange. The Grinch sneaks in one night and grabs a simple random sample (without replacement) of 15 marbles.
(a)…
Suppose an experiment was conducted to compare the mileage(km) per litre
obtained by competing brands of petrol I,II,III. Three new Mazda, three new
Toyota and three new Nissan cars were available for experimentation. During the
experiment the cars would operate under same conditions in order to eliminate
the effect of external variables on the distance travelled per litre on the assigned
brand of petrol. The data is given as below:
Brands of Petrol Mazda Toyota Nissan
I 10.6 12.0 11.0
II 9.0 15.0 12.0
III 12.0 17.4 13.0
(a) Test at the 5% level of significance whether there are signi
cant differences among the brands of fuels and also among the cars. [10]
(b) Compute the standard error for comparing any two fuel brands means. Hence
compare, at the 5% level of significance, each of fuel brands II, and III with
the standard fuel brand I. [10] �
Business discuss
Chapter 5 Solutions
Introductory Statistics
Ch. 5 - Consider the function f(x)=18 for 0x8 0. Draw the...Ch. 5 - The data the follow are the number of passengers...Ch. 5 - A distribution is given as X ~U(0, 20). What is...Ch. 5 - The total duration of baseball games in the major...Ch. 5 - Suppose the time it takes a student to finish a...Ch. 5 - The amount of time a service technician needs to...Ch. 5 - The amount of time spouses shop for anniversary...Ch. 5 - The number of days ahead travelers purchase their...Ch. 5 - On average, a pair of running shoes can last 18...Ch. 5 - Suppose that the distance, in miles, that people...
Ch. 5 - Suppose that on a certain stretch of highway, cars...Ch. 5 - Suppose that the longevity of a light bulb is...Ch. 5 - In a small city the number of automobile accidents...Ch. 5 - Which type of distribution does the graph...Ch. 5 - Which type of distribution does the graph...Ch. 5 - Which type of distribution does the graph...Ch. 5 - What does the shaded area represent? P(_< x <_)...Ch. 5 - What does the shaded area represent? P(______...Ch. 5 - For a continuous probablity distribution, 0x15 ....Ch. 5 - What is the area under f(x) if the function is a...Ch. 5 - For a continuous probability distribution, 0x10 ....Ch. 5 - A continuous probability function is restricted to...Ch. 5 - f(x) for a continuous probability function is 15 ,...Ch. 5 - f(x) , a continuous probability function, is equal...Ch. 5 - Find the probability that x falls in the shaded...Ch. 5 - Find the probability that x falls in the shaded...Ch. 5 - Find the probability that x falls in the shaded...Ch. 5 - m:math display='block'>f(x), a continuous...Ch. 5 - Use the following information to answer the next...Ch. 5 - Use the following information to answer the next...Ch. 5 - Use the following information to answer the next...Ch. 5 - Use the following information to answer the next...Ch. 5 - Use the following information to answer the next...Ch. 5 - Use the following information to answer the next...Ch. 5 - the following information to answer the next ten...Ch. 5 - Use the following information to answer the next...Ch. 5 - Use the following information to answer the next...Ch. 5 - Use the following information to answer the next...Ch. 5 - Use the following information to answer the next...Ch. 5 - Use the following information to answer the next...Ch. 5 - Use the following information to answer the next...Ch. 5 - Use the following information to answer the next...Ch. 5 - Use the following information to answer the next...Ch. 5 - Use the following information to answer the next...Ch. 5 - Use the following information to answer the next...Ch. 5 - Use the following information to answer the next...Ch. 5 - Use the following information to answer the next...Ch. 5 - Use the following information to answer the next...Ch. 5 - Use the following information to answer the next...Ch. 5 - Use the following information to answer the next...Ch. 5 - Use the following information to answer the next...Ch. 5 - Use the following information to answer the next...Ch. 5 - Use the following information to answer the next...Ch. 5 - Use the following information to answer the next...Ch. 5 - Use the following information to answer the next...Ch. 5 - Use the following information to answer the next...Ch. 5 - Use the following information to answer the next...Ch. 5 - Find the third quartile of ages of cars In the...Ch. 5 - Use the following information to answer the next...Ch. 5 - Use the following information to answer the next...Ch. 5 - Use the following information to answer the next...Ch. 5 - Use the following information to answer the next...Ch. 5 - Use the following information to answer the next...Ch. 5 - Use the following information to answer the next...Ch. 5 - Use the following information to answer the next...Ch. 5 - Use the following information to answer the next...Ch. 5 - Use the following information to answer the next...Ch. 5 - Use the following information to answer the next...Ch. 5 - Use the following information to answer the next...Ch. 5 - Use the following information to answer the next...Ch. 5 - Use the following information to answer the next...Ch. 5 - Use the following information to answer the next...Ch. 5 - Use the following information to answer the next...Ch. 5 - Use the following information to answer the next...Ch. 5 - Use the following information to answer the next...Ch. 5 - Use the following information to answer the next...Ch. 5 - Use the following information to answer the next...Ch. 5 - Use the following information to answer the next...Ch. 5 - Use the following information to answer the next...Ch. 5 - Use the following information to answer the next...Ch. 5 - Use the following information to answer the next...Ch. 5 - Use the following information to answer the net 16...Ch. 5 - Use the following information to answer the net 16...Ch. 5 - Use the following information to answer the net 16...Ch. 5 - For each probability and percentile problem, draw...Ch. 5 - For each probability and percentile problem, draw...Ch. 5 - For each probability and percentile problem, draw...Ch. 5 - For each probability and percentile problem, draw...Ch. 5 - For each probability and percentile problem, draw...Ch. 5 - For each probability and percentile problem, draw...Ch. 5 - For each probability and percentile problem, draw...Ch. 5 - Use the following information o answer the next...Ch. 5 - Use the following information o answer the next...Ch. 5 - Use the following information o answer the next...Ch. 5 - The time (In minutes) until the next bus departs a...Ch. 5 - Suppose that the value of a stock varies each day...Ch. 5 - A fireworks show is designed so that the time...Ch. 5 - The number of miles driven by a truck driver falls...Ch. 5 - Suppose that the length of long distance phone...Ch. 5 - Suppose that the useful life of a particular car...Ch. 5 - The percent of persons (ages five and older) in...Ch. 5 - The time (In years) after reaching age 60 that ft...Ch. 5 - The cost of all maintenance for a car during fts...Ch. 5 - Use the following information to answer the next...Ch. 5 - Use the following information to answer the next...Ch. 5 - Use the following information to answer the next...Ch. 5 - Let X ~ Exp(0.l). a. decay rate = _________ b. ...Ch. 5 - Suppose that the longevity of a light bulb is...Ch. 5 - At a 911 call center, calls come in a an average...Ch. 5 - In major league baseball, a no-hitter is a game in...Ch. 5 - During the years 1998—2012. a total of 29...Ch. 5 - According to the American Red Cross. about one out...Ch. 5 - A web site experiences traffic during normal...Ch. 5 - At an urgent care faci11t; patients arrive at an...
Additional Math Textbook Solutions
Find more solutions based on key concepts
Earnings A sociologist says, “Typically, men in the United States still earn more than women.” What does this s...
Introductory Statistics
Shell method Let R be the region bounded by the following curves. Use the shell method to find the volume of th...
Calculus: Early Transcendentals (2nd Edition)
CHECK POINT 1 Write a word description of the set L = {a, b, c, d, e, f}.
Thinking Mathematically (6th Edition)
A student has to sell 2 books from a collection of 6 math, 7 science, and 4 economics books. How many choices a...
A First Course in Probability (10th Edition)
In Exercises 5-20, find the range, variance, and standard deviation for the given sample data. Include appropri...
Elementary Statistics (13th Edition)
Knowledge Booster


Learn more about
Need a deep-dive on the concept behind this application? Look no further. Learn more about this topic, statistics and related others by exploring similar questions and additional content below.Similar questions
- What would you say about a set of quantitative bivariate data whose linear correlation is -1? What would a scatter diagram of the data look like? (5 points)arrow_forwardBusiness discussarrow_forwardAnalyze the residuals of a linear regression model and select the best response. yes, the residual plot does not show a curve no, the residual plot shows a curve yes, the residual plot shows a curve no, the residual plot does not show a curve I answered, "No, the residual plot shows a curve." (and this was incorrect). I am not sure why I keep getting these wrong when the answer seems obvious. Please help me understand what the yes and no references in the answer.arrow_forward
- a. Find the value of A.b. Find pX(x) and py(y).c. Find pX|y(x|y) and py|X(y|x)d. Are x and y independent? Why or why not?arrow_forwardAnalyze the residuals of a linear regression model and select the best response.Criteria is simple evaluation of possible indications of an exponential model vs. linear model) no, the residual plot does not show a curve yes, the residual plot does not show a curve yes, the residual plot shows a curve no, the residual plot shows a curve I selected: yes, the residual plot shows a curve and it is INCORRECT. Can u help me understand why?arrow_forwardYou have been hired as an intern to run analyses on the data and report the results back to Sarah; the five questions that Sarah needs you to address are given below. please do it step by step on excel Does there appear to be a positive or negative relationship between price and screen size? Use a scatter plot to examine the relationship. Determine and interpret the correlation coefficient between the two variables. In your interpretation, discuss the direction of the relationship (positive, negative, or zero relationship). Also discuss the strength of the relationship. Estimate the relationship between screen size and price using a simple linear regression model and interpret the estimated coefficients. (In your interpretation, tell the dollar amount by which price will change for each unit of increase in screen size). Include the manufacturer dummy variable (Samsung=1, 0 otherwise) and estimate the relationship between screen size, price and manufacturer dummy as a multiple…arrow_forward
- Here is data with as the response variable. x y54.4 19.124.9 99.334.5 9.476.6 0.359.4 4.554.4 0.139.2 56.354 15.773.8 9-156.1 319.2Make a scatter plot of this data. Which point is an outlier? Enter as an ordered pair, e.g., (x,y). (x,y)= Find the regression equation for the data set without the outlier. Enter the equation of the form mx+b rounded to three decimal places. y_wo= Find the regression equation for the data set with the outlier. Enter the equation of the form mx+b rounded to three decimal places. y_w=arrow_forwardYou have been hired as an intern to run analyses on the data and report the results back to Sarah; the five questions that Sarah needs you to address are given below. please do it step by step Does there appear to be a positive or negative relationship between price and screen size? Use a scatter plot to examine the relationship. Determine and interpret the correlation coefficient between the two variables. In your interpretation, discuss the direction of the relationship (positive, negative, or zero relationship). Also discuss the strength of the relationship. Estimate the relationship between screen size and price using a simple linear regression model and interpret the estimated coefficients. (In your interpretation, tell the dollar amount by which price will change for each unit of increase in screen size). Include the manufacturer dummy variable (Samsung=1, 0 otherwise) and estimate the relationship between screen size, price and manufacturer dummy as a multiple linear…arrow_forwardExercises: Find all the whole number solutions of the congruence equation. 1. 3x 8 mod 11 2. 2x+3= 8 mod 12 3. 3x+12= 7 mod 10 4. 4x+6= 5 mod 8 5. 5x+3= 8 mod 12arrow_forward
- Scenario Sales of products by color follow a peculiar, but predictable, pattern that determines how many units will sell in any given year. This pattern is shown below Product Color 1995 1996 1997 Red 28 42 21 1998 23 1999 29 2000 2001 2002 Unit Sales 2003 2004 15 8 4 2 1 2005 2006 discontinued Green 26 39 20 22 28 14 7 4 2 White 43 65 33 36 45 23 12 Brown 58 87 44 48 60 Yellow 37 56 28 31 Black 28 42 21 Orange 19 29 Purple Total 28 42 21 49 68 78 95 123 176 181 164 127 24 179 Questions A) Which color will sell the most units in 2007? B) Which color will sell the most units combined in the 2007 to 2009 period? Please show all your analysis, leave formulas in cells, and specify any assumptions you make.arrow_forwardOne hundred students were surveyed about their preference between dogs and cats. The following two-way table displays data for the sample of students who responded to the survey. Preference Male Female TOTAL Prefers dogs \[36\] \[20\] \[56\] Prefers cats \[10\] \[26\] \[36\] No preference \[2\] \[6\] \[8\] TOTAL \[48\] \[52\] \[100\] problem 1 Find the probability that a randomly selected student prefers dogs.Enter your answer as a fraction or decimal. \[P\left(\text{prefers dogs}\right)=\] Incorrect Check Hide explanation Preference Male Female TOTAL Prefers dogs \[\blueD{36}\] \[\blueD{20}\] \[\blueE{56}\] Prefers cats \[10\] \[26\] \[36\] No preference \[2\] \[6\] \[8\] TOTAL \[48\] \[52\] \[100\] There were \[\blueE{56}\] students in the sample who preferred dogs out of \[100\] total students.arrow_forwardBusiness discussarrow_forward
arrow_back_ios
SEE MORE QUESTIONS
arrow_forward_ios
Recommended textbooks for you
 Glencoe Algebra 1, Student Edition, 9780079039897...AlgebraISBN:9780079039897Author:CarterPublisher:McGraw Hill
 Big Ideas Math A Bridge To Success Algebra 1: Stu...AlgebraISBN:9781680331141Author:HOUGHTON MIFFLIN HARCOURTPublisher:Houghton Mifflin Harcourt
 Holt Mcdougal Larson Pre-algebra: Student Edition...AlgebraISBN:9780547587776Author:HOLT MCDOUGALPublisher:HOLT MCDOUGAL
 Trigonometry (MindTap Course List)TrigonometryISBN:9781337278461Author:Ron LarsonPublisher:Cengage Learning
 Trigonometry (MindTap Course List)TrigonometryISBN:9781305652224Author:Charles P. McKeague, Mark D. TurnerPublisher:Cengage Learning
Glencoe Algebra 1, Student Edition, 9780079039897...
Algebra
ISBN:9780079039897
Author:Carter
Publisher:McGraw Hill
Big Ideas Math A Bridge To Success Algebra 1: Stu...
Algebra
ISBN:9781680331141
Author:HOUGHTON MIFFLIN HARCOURT
Publisher:Houghton Mifflin Harcourt
Holt Mcdougal Larson Pre-algebra: Student Edition...
Algebra
ISBN:9780547587776
Author:HOLT MCDOUGAL
Publisher:HOLT MCDOUGAL
Trigonometry (MindTap Course List)
Trigonometry
ISBN:9781337278461
Author:Ron Larson
Publisher:Cengage Learning
Trigonometry (MindTap Course List)
Trigonometry
ISBN:9781305652224
Author:Charles P. McKeague, Mark D. Turner
Publisher:Cengage Learning
How to make Frequency Distribution Table / Tally Marks and Frequency Distribution Table; Author: Reenu Math;https://www.youtube.com/watch?v=i_A6RiE8tLE;License: Standard YouTube License, CC-BY
Frequency distribution table in statistics; Author: Math and Science;https://www.youtube.com/watch?v=T7KYO76DoOE;License: Standard YouTube License, CC-BY
Frequency Distribution Table for Grouped/Continuous data | Math Dot Com; Author: Maths dotcom;https://www.youtube.com/watch?v=ErnccbXQOPY;License: Standard Youtube License