Videos
Write a
There are a variety of ways to deal with the month names. One straightforward method is to code the months as integers and then do a conversion before doing the output. A large switch statement is acceptable in an output function. The month input can be handled in any manner you wish, as long as it is relatively easy and pleasant for the user.
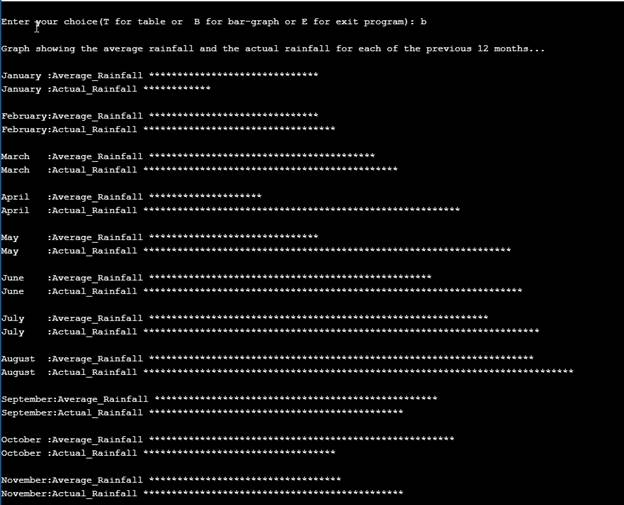
After you have completed the previous program, produce an enhanced version that also outputs a graph showing the average rainfall and the actual rainfall for each of the previous 12 months. The graph should be similar to the one shown in Display 5.4, except that there should be two bar graphs for each month, and they should be labeled as the average rainfall and the rainfall for the most recent month. Your program should ask the user whether he or she wants to see the table or the bar graph, and then should display whichever format is requested. Include a loop that allows the user to see either format as often as the user wishes until the user requests that the program end.
Program plan:
- Necessary header files are included.
- Four functions table (),barGraph(),barAsterisks(),displayMonth () are declared for various functions and defined inside the main() function
- double actualRainfall[12],double avgRainfall[12], double statusRainfall[12],int currentMonth, char userChoice, int count variables are declared of different data types to store multiple values required in the program.
- For loops are used for various conditions.
- A do-while loop is used to exit from the program.
- A switch statement is used for printing the different month names according the choice of month.
Program Description:
The main purpose of the program is to compare the rainfall of 12 months in a city. Comparison of average monthly rainfall and actual monthly rainfall is shown either in tabular form or with the help of Bar Graph.
Explanation of Solution
Sample Program
/*Header files section*/
#include<iostream>
#include<stdlib.h>
#include<string>
#include <iomanip>
using namespace std;
//Function declaration
void table(double actualRainfall[], double avgRainfall[],
double statusRainfall[]);
void barGraph(double avgRainfall[], double actualRainfall[],
double statusRainfall[]);
void barAsterisks(int stars);
void displayMonth(int month);
//main method
int main()
{
//Declare variables
double actualRainfall[12];
double avgRainfall[12];
double statusRainfall[12];
int currentMonth;
char userChoice;
int count=0;
//Prompt and read each month's rainfall
//from the user
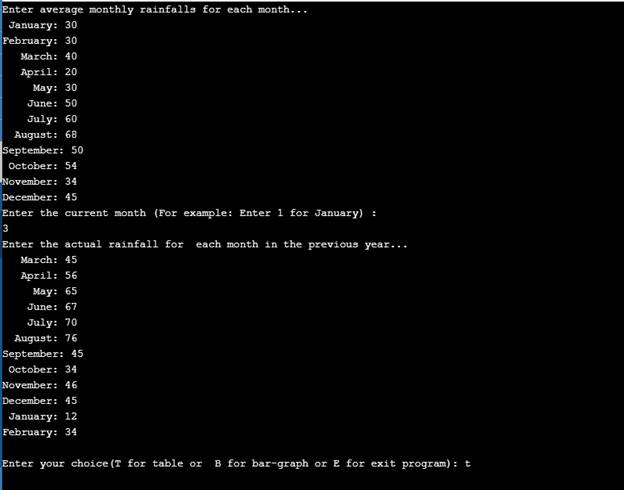
cout << "Enter average monthly "
<< "rainfalls for each month..." << endl;
for (int i = 0; i < 12; i++)
{
displayMonth(i);
cout << ": ";
cin >> avgRainfall[i];
}
//Prompt and read the current month
// and then asks for the rainfall figures
//for the previous 12 months
cout << "Enter the current month "
"(For example: Enter 1 for January) : "
<< endl;
cin >> currentMonth;
cout << "Enter the actual rainfall for "
" each month in the previous year..."
<< endl;
for (int month = currentMonth - 1; count < 12;
month = (month + 1) % 12, count++)
{
displayMonth(month);
cout << ": ";
cin >> actualRainfall[month];
}
for (int i = 0, j = 0; i < 12; i++, j++)
{
if (avgRainfall[i] > actualRainfall[i])
statusRainfall[j] = actualRainfall[i] - avgRainfall[i];
else
statusRainfall[j] = actualRainfall[i] - avgRainfall[i];
}
cout << endl;
//do-while loop to see either table or bar
do
{
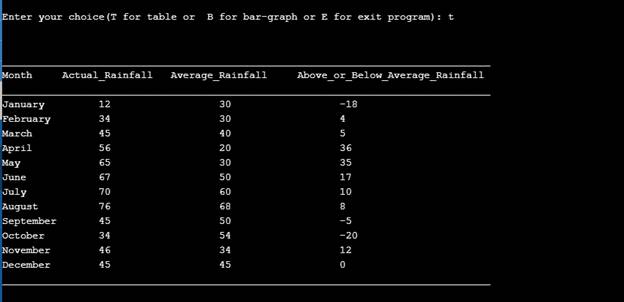
cout << "Enter your choice(T for table or "
" B for bar-graph or E for exit program): ";
cin >> userChoice;
cout << endl;
if (userChoice == 'T' || userChoice == 't')
table(actualRainfall, avgRainfall, statusRainfall);
else if (userChoice == 'B' || userChoice == 'b')
barGraph(avgRainfall, actualRainfall, statusRainfall);
else if (userChoice == 'E' || userChoice == 'e')
{
cout << "Exit the program...Thank you"<<endl;
exit(0);
}
cout << endl;
} while (true);
return 0;
}
//Method definition of table
void table(double rainfall[], double avgRainfall[],
double statusRainfall[])
{
cout << endl;
cout << "___________________________________________"
"______________________________________" << endl;
cout << "Month" << setw(20)
<< "Actual_Rainfall" << setw(20)
<< "Average_Rainfall "<< setw(25)
<< " Above_or_Below_Average_Rainfall"
<< setw(20) << endl;
cout << "___________________________________________"
"______________________________________" << endl;
for (int i = 0; i < 12; i++)
{
cout.setf(ios_base::left);
displayMonth(i);
cout << "\t" << setw(20) << rainfall[i] << setw(20)
<< avgRainfall[i] << setw(20) << statusRainfall[i];
cout << endl;
}
cout << "_____________________________________________"
"____________________________________" << endl;
}
//Method definition of barGraph
void barGraph(double avgRainfall[], double rainfall[], double statusRainfall[])
{
cout << "Graph showing the average rainfall "
"and the actual rainfall for each of the "
"previous 12 months..." << endl;
cout << endl;
for (int i = 0; i < 12; i++)
{
displayMonth(i);
cout << ":" << "Average_Rainfall" << " ";
int n1 = (int)avgRainfall[i];
barAsterisks(n1);
cout << endl;
displayMonth(i);
cout << ":" << "Actual_Rainfall" << " ";
int n = (int)rainfall[i];
barAsterisks(n);
cout << endl;
cout << endl;
}
}
//Method definition of barAsterisks
void barAsterisks(int stars)
{
for (int count = 1; count <= stars; count++)
cout << "*";
}
//Method definition of displayMonth
void displayMonth(int month)
{
cout.width(8);
switch (month)
{
case 0:
cout << "January";
break;
case 1:
cout << "February";
break;
case 2:
cout << "March";
break;
case 3:
cout << "April";
break;
case 4:
cout << "May";
break;
case 5:
cout << "June";
break;
case 6:
cout << "July";
break;
case 7:
cout << "August";
break;
case 8:
cout << "September";
break;
case 9:
cout << "October";
break;
case 10:
cout << "November";
break;
case 11:
cout << "December";
break;
}
}
Explanation:
In the above program, user inputs the average and actual monthly rainfall for the 12 months. After that a comparison is made between the average and actual rainfall of the particular month. Different options are provided to the user to display the comparison of rainfalls of the months either in Tabular form or as Bar Graph. In that option only, user can choose to exit the program by choosing the provided option. In the last according to the choice of user, data is displayed either in Tabular form or as Bar Graph.
Sample Output:
Want to see more full solutions like this?
Chapter 5 Solutions
Absolute C++
Additional Engineering Textbook Solutions
Problem Solving with C++ (10th Edition)
Thinking Like an Engineer: An Active Learning Approach (4th Edition)
Starting Out with Python (4th Edition)
Java How to Program, Early Objects (11th Edition) (Deitel: How to Program)
Starting Out with C++: Early Objects (9th Edition)
Starting Out with Java: From Control Structures through Objects (7th Edition) (What's New in Computer Science)


- Here are two diagrams. Make them very explicit, similar to Example Diagram 3 (the Architecture of MSCTNN). graph LR subgraph Teacher_Model_B [Teacher Model (Pretrained)] Input_Teacher_B[Input C (Complete Data)] --> Teacher_Encoder_B[Transformer Encoder T] Teacher_Encoder_B --> Teacher_Prediction_B[Teacher Prediction y_T] Teacher_Encoder_B --> Teacher_Features_B[Internal Features F_T] end subgraph Student_B_Model [Student Model B (Handles Missing Labels)] Input_Student_B[Input C (Complete Data)] --> Student_B_Encoder[Transformer Encoder E_B] Student_B_Encoder --> Student_B_Prediction[Student B Prediction y_B] end subgraph Knowledge_Distillation_B [Knowledge Distillation (Student B)] Teacher_Prediction_B -- Logits Distillation Loss (L_logits_B) --> Total_Loss_B Teacher_Features_B -- Feature Alignment Loss (L_feature_B) --> Total_Loss_B Partial_Labels_B[Partial Labels y_p] -- Prediction Loss (L_pred_B) --> Total_Loss_B Total_Loss_B -- Backpropagation -->…arrow_forwardPlease provide me with the output image of both of them . below are the diagrams code I have two diagram : first diagram code graph LR subgraph Teacher Model (Pretrained) Input_Teacher[Input C (Complete Data)] --> Teacher_Encoder[Transformer Encoder T] Teacher_Encoder --> Teacher_Prediction[Teacher Prediction y_T] Teacher_Encoder --> Teacher_Features[Internal Features F_T] end subgraph Student_A_Model[Student Model A (Handles Missing Values)] Input_Student_A[Input M (Data with Missing Values)] --> Student_A_Encoder[Transformer Encoder E_A] Student_A_Encoder --> Student_A_Prediction[Student A Prediction y_A] Student_A_Encoder --> Student_A_Features[Student A Features F_A] end subgraph Knowledge_Distillation_A [Knowledge Distillation (Student A)] Teacher_Prediction -- Logits Distillation Loss (L_logits_A) --> Total_Loss_A Teacher_Features -- Feature Alignment Loss (L_feature_A) --> Total_Loss_A Ground_Truth_A[Ground Truth y_gt] -- Prediction Loss (L_pred_A)…arrow_forwardI'm reposting my question again please make sure to avoid any copy paste from the previous answer because those answer did not satisfy or responded to the need that's why I'm asking again The knowledge distillation part is not very clear in the diagram. Please create two new diagrams by separating the two student models: First Diagram (Student A - Missing Values): Clearly illustrate the student training process. Show how knowledge distillation happens between the teacher and Student A. Explain what the teacher teaches Student A (e.g., handling missing values) and how this teaching occurs (e.g., through logits, features, or attention). Second Diagram (Student B - Missing Labels): Similarly, detail the training process for Student B. Clarify how knowledge distillation works between the teacher and Student B. Specify what the teacher teaches Student B (e.g., dealing with missing labels) and how the knowledge is transferred. Since these are two distinct challenges…arrow_forward
- The knowledge distillation part is not very clear in the diagram. Please create two new diagrams by separating the two student models: First Diagram (Student A - Missing Values): Clearly illustrate the student training process. Show how knowledge distillation happens between the teacher and Student A. Explain what the teacher teaches Student A (e.g., handling missing values) and how this teaching occurs (e.g., through logits, features, or attention). Second Diagram (Student B - Missing Labels): Similarly, detail the training process for Student B. Clarify how knowledge distillation works between the teacher and Student B. Specify what the teacher teaches Student B (e.g., dealing with missing labels) and how the knowledge is transferred. Since these are two distinct challenges (missing values vs. missing labels), they should not be combined in the same diagram. Instead, create two separate diagrams for clarity. For reference, I will attach a second image…arrow_forwardNote : please avoid using AI answer the question by carefully reading it and provide a clear and concise solutionHere is a clear background and explanation of the full method, including what each part is doing and why. Background & Motivation Missing values: Some input features (sensor channels) are missing for some samples due to sensor failure or corruption. Missing labels: Not all samples have a ground-truth RUL value. For example, data collected during normal operation is often unlabeled. Most traditional deep learning models require complete data and full labels. But in our case, both are incomplete. If we try to train a model directly, it will either fail to learn properly or discard valuable data. What We Are Doing: Overview We solve this using a Teacher–Student knowledge distillation framework: We train a Teacher model on a clean and complete dataset where both inputs and labels are available. We then use that Teacher to teach two separate Student models: Student A learns…arrow_forwardHere is a clear background and explanation of the full method, including what each part is doing and why. Background & Motivation Missing values: Some input features (sensor channels) are missing for some samples due to sensor failure or corruption. Missing labels: Not all samples have a ground-truth RUL value. For example, data collected during normal operation is often unlabeled. Most traditional deep learning models require complete data and full labels. But in our case, both are incomplete. If we try to train a model directly, it will either fail to learn properly or discard valuable data. What We Are Doing: Overview We solve this using a Teacher–Student knowledge distillation framework: We train a Teacher model on a clean and complete dataset where both inputs and labels are available. We then use that Teacher to teach two separate Student models: Student A learns from incomplete input (some sensor values missing). Student B learns from incomplete labels (RUL labels missing…arrow_forward
- here is a diagram code : graph LR subgraph Inputs [Inputs] A[Input C (Complete Data)] --> TeacherModel B[Input M (Missing Data)] --> StudentA A --> StudentB end subgraph TeacherModel [Teacher Model (Pretrained)] C[Transformer Encoder T] --> D{Teacher Prediction y_t} C --> E[Internal Features f_t] end subgraph StudentA [Student Model A (Trainable - Handles Missing Input)] F[Transformer Encoder S_A] --> G{Student A Prediction y_s^A} B --> F end subgraph StudentB [Student Model B (Trainable - Handles Missing Labels)] H[Transformer Encoder S_B] --> I{Student B Prediction y_s^B} A --> H end subgraph GroundTruth [Ground Truth RUL (Partial Labels)] J[RUL Labels] end subgraph KnowledgeDistillationA [Knowledge Distillation Block for Student A] K[Prediction Distillation Loss (y_s^A vs y_t)] L[Feature Alignment Loss (f_s^A vs f_t)] D -- Prediction Guidance --> K E -- Feature Guidance --> L G --> K F --> L J -- Supervised Guidance (if available) --> G K…arrow_forwarddetails explanation and background We solve this using a Teacher–Student knowledge distillation framework: We train a Teacher model on a clean and complete dataset where both inputs and labels are available. We then use that Teacher to teach two separate Student models: Student A learns from incomplete input (some sensor values missing). Student B learns from incomplete labels (RUL labels missing for some samples). We use knowledge distillation to guide both students, even when labels are missing. Why We Use Two Students Student A handles Missing Input Features: It receives input with some features masked out. Since it cannot see the full input, we help it by transferring internal features (feature distillation) and predictions from the teacher. Student B handles Missing RUL Labels: It receives full input but does not always have a ground-truth RUL label. We guide it using the predictions of the teacher model (prediction distillation). Using two students allows each to specialize in…arrow_forwardWe are doing a custom JSTL custom tag to make display page to access a tag handler. Write two custom tags: 1) A single tag which prints a number (from 0-99) as words. Ex: <abc:numAsWords val="32"/> --> produces: thirty-two 2) A paired tag which puts the body in a DIV with our team colors. Ex: <abc:teamColors school="gophers" reverse="true"> <p>Big game today</p> <p>Bring your lucky hat</p> <-- these will be green text on blue background </abc:teamColors> Details: The attribute for numAsWords will be just val, from 0 to 99 - spelling, etc... isn't important here. Print "twenty-six" or "Twenty six" ... . Attributes for teamColors are: school, a "required" string, and reversed, a non-required boolean. - pick any four schools. I picked gophers, cyclones, hawkeyes and cornhuskers - each school has two colors. Pick whatever seems best. For oine I picked "cyclones" and red text on a gold body - if…arrow_forward
- I want a database on MySQL to analyze blood disease analyses with a selection of all its commands, with an ER drawing, and a complete chart for normalization. I want them completely.arrow_forwardAssignment Instructions: You are tasked with developing a program to use city data from an online database and generate a city details report. 1) Create a new Project in Eclipse called "HW7". 2) Create a class "City.java" in the project and implement the UML diagram shown below and add comments to your program. 3) The logic for the method "getCityCategory" of City Class is below: a. If the population of a city is greater than 10000000, then the method returns "MEGA" b. If the population of a city is greater than 1000000 and less than 10000000, then the method returns "LARGE" c. If the population of a city is greater than 100000 and less than 1000000, then the method returns "MEDIUM" d. If the population of a city is below 100000, then the method returns "SMALL" 4) You should create another new Java program inside the project. Name the program as "xxxx_program.java”, where xxxx is your Kean username. 3) Implement the following methods inside the xxxx_program program The main method…arrow_forwardCPS 2231 - Computer Programming – Spring 2025 City Report Application - Due Date: Concepts: Classes and Objects, Reading from a file and generating report Point value: 40 points. The purpose of this project is to give students exposure to object-oriented design and programming using classes in a realistic application that involves arrays of objects and generating reports. Assignment Instructions: You are tasked with developing a program to use city data from an online database and generate a city details report. 1) Create a new Project in Eclipse called "HW7”. 2) Create a class "City.java" in the project and implement the UML diagram shown below and add comments to your program. 3) The logic for the method "getCityCategory" of City Class is below: a. If the population of a city is greater than 10000000, then the method returns "MEGA" b. If the population of a city is greater than 1000000 and less than 10000000, then the method returns "LARGE" c. If the population of a city is greater…arrow_forward
 C++ Programming: From Problem Analysis to Program...Computer ScienceISBN:9781337102087Author:D. S. MalikPublisher:Cengage Learning
 C++ for Engineers and ScientistsComputer ScienceISBN:9781133187844Author:Bronson, Gary J.Publisher:Course Technology Ptr
 Programming Logic & Design ComprehensiveComputer ScienceISBN:9781337669405Author:FARRELLPublisher:Cengage
 Microsoft Visual C#Computer ScienceISBN:9781337102100Author:Joyce, Farrell.Publisher:Cengage Learning,