Videos
Write a
There are a variety of ways to deal with the month names. One straightforward method is to code the months as integers and then do a conversion before doing the output. A large switch statement is acceptable in an output function. The month input can be handled in any manner you wish, as long as it is relatively easy and pleasant for the user.
After you have completed the previous program, produce an enhanced version that also outputs a graph showing the average rainfall and the actual rainfall for each of the previous 12 months. The graph should be similar to the one shown in Display 5.4, except that there should be two bar graphs for each month, and they should be labeled as the average rainfall and the rainfall for the most recent month. Your program should ask the user whether he or she wants to see the table or the bar graph, and then should display whichever format is requested. Include a loop that allows the user to see either format as often as the user wishes until the user requests that the program end.
Program plan:
- Necessary header files are included.
- Four functions table (),barGraph(),barAsterisks(),displayMonth () are declared for various functions and defined inside the main() function
- double actualRainfall[12],double avgRainfall[12], double statusRainfall[12],int currentMonth, char userChoice, int count variables are declared of different data types to store multiple values required in the program.
- For loops are used for various conditions.
- A do-while loop is used to exit from the program.
- A switch statement is used for printing the different month names according the choice of month.
Program Description:
The main purpose of the program is to compare the rainfall of 12 months in a city. Comparison of average monthly rainfall and actual monthly rainfall is shown either in tabular form or with the help of Bar Graph.
Explanation of Solution
Sample Program
/*Header files section*/
#include<iostream>
#include<stdlib.h>
#include<string>
#include <iomanip>
using namespace std;
//Function declaration
void table(double actualRainfall[], double avgRainfall[],
   double statusRainfall[]);
void barGraph(double avgRainfall[], double actualRainfall[],
   double statusRainfall[]);
void barAsterisks(int stars);
void displayMonth(int month);

//main method
int main()
{
   //Declare variables
   double actualRainfall[12];
   double avgRainfall[12];
   double statusRainfall[12];
   int currentMonth;
   char userChoice;
   int count=0;
   //Prompt and read each month's rainfall
   //from the user
   cout << "Enter average monthly "
       << "rainfalls for each month..." << endl;
   for (int i = 0; i < 12; i++)
   {
       displayMonth(i);
       cout << ": ";
       cin >> avgRainfall[i];
   }
     //Prompt and read the current month
   // and then asks for the rainfall figures
   //for the previous 12 months
   cout << "Enter the current month "
       "(For example: Enter 1 for January) : "
       << endl;
   cin >> currentMonth;
   cout << "Enter the actual rainfall for "
       " each month in the previous year..."
       << endl;

   for (int month = currentMonth - 1; count < 12;
       month = (month + 1) % 12, count++)
   {
       displayMonth(month);
       cout << ": ";
       cin >> actualRainfall[month];
   }
   for (int i = 0, j = 0; i < 12; i++, j++)
   {
       if (avgRainfall[i] > actualRainfall[i])
           statusRainfall[j] = actualRainfall[i] - avgRainfall[i];
       else
           statusRainfall[j] = actualRainfall[i] - avgRainfall[i];
   }
   cout << endl;
   //do-while loop to see either table or bar
   do
   {
       cout << "Enter your choice(T for table or "
           " B for bar-graph or E for exit program): ";
       cin >> userChoice;
       cout << endl;
       if (userChoice == 'T' || userChoice == 't')
           table(actualRainfall, avgRainfall, statusRainfall);
       else if (userChoice == 'B' || userChoice == 'b')
           barGraph(avgRainfall, actualRainfall, statusRainfall);
       else if (userChoice == 'E' || userChoice == 'e')
       {
           cout << "Exit the program...Thank you"<<endl;
               exit(0);
       }
       cout << endl;
   } while (true);
   return 0;
}
//Method definition of table
void table(double rainfall[], double avgRainfall[],
   double statusRainfall[])
{
   cout << endl;
   cout << "___________________________________________"
       "______________________________________" << endl;
   cout << "Month" << setw(20)
       << "Actual_Rainfall" << setw(20)
       << "Average_Rainfall "<< setw(25)
       << "    Above_or_Below_Average_Rainfall"
       << setw(20) << endl;
   cout << "___________________________________________"
       "______________________________________" << endl;
   for (int i = 0; i < 12; i++)
   {
       cout.setf(ios_base::left);
       displayMonth(i);
       cout << "\t" << setw(20) << rainfall[i] << setw(20)
           << avgRainfall[i] << setw(20) << statusRainfall[i];
       cout << endl;
   }
   cout << "_____________________________________________"
       "____________________________________" << endl;
}
//Method definition of barGraph
void barGraph(double avgRainfall[], double rainfall[], double statusRainfall[])
{
   cout << "Graph showing the average rainfall "
       "and the actual rainfall for each of the "
       "previous 12 months..." << endl;
   cout << endl;
   for (int i = 0; i < 12; i++)
   {
       displayMonth(i);
       cout << ":" << "Average_Rainfall" << " ";
       int n1 = (int)avgRainfall[i];
       barAsterisks(n1);
       cout << endl;
       displayMonth(i);
       cout << ":" << "Actual_Rainfall" << " ";
       int n = (int)rainfall[i];
       barAsterisks(n);
       cout << endl;
       cout << endl;
   }
}
//Method definition of barAsterisks
void barAsterisks(int stars)
{
   for (int count = 1; count <= stars; count++)
       cout << "*";
}
//Method definition of displayMonth
void displayMonth(int month)
{
   cout.width(8);
   switch (month)
   {
   case 0:
       cout << "January";
       break;
   case 1:
       cout << "February";
       break;
   case 2:
       cout << "March";
       break;
   case 3:
       cout << "April";
       break;
   case 4:
       cout << "May";
       break;
   case 5:
       cout << "June";
       break;
   case 6:
       cout << "July";
       break;
   case 7:
       cout << "August";
       break;
   case 8:
       cout << "September";
       break;
   case 9:
       cout << "October";
       break;
   case 10:
       cout << "November";
       break;
   case 11:
       cout << "December";
       break;
   }
}
Explanation:
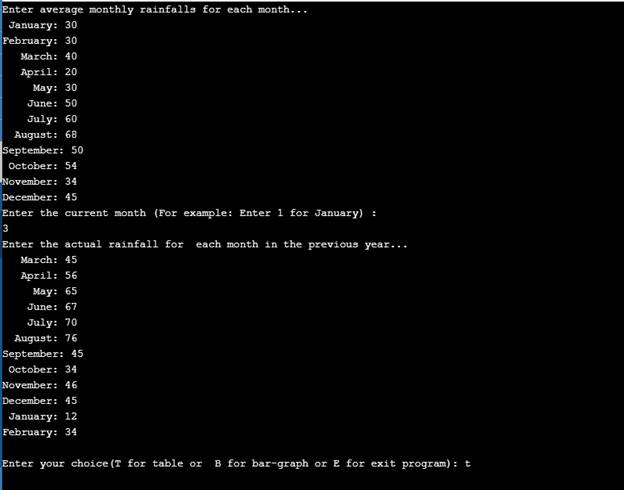
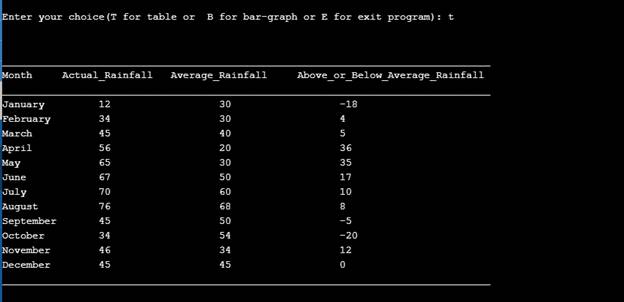
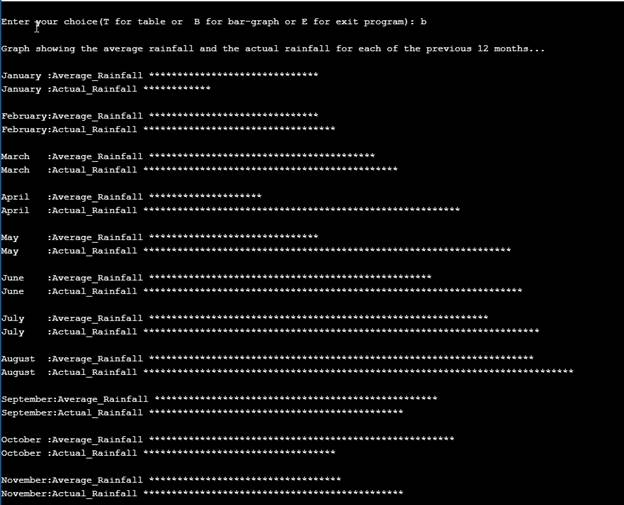
In the above program, user inputs the average and actual monthly rainfall for the 12 months. After that a comparison is made between the average and actual rainfall of the particular month. Different options are provided to the user to display the comparison of rainfalls of the months either in Tabular form or as Bar Graph. In that option only, user can choose to exit the program by choosing the provided option. In the last according to the choice of user, data is displayed either in Tabular form or as Bar Graph.
Sample Output:
Want to see more full solutions like this?
Chapter 5 Solutions
Absolute C++
Additional Engineering Textbook Solutions
Problem Solving with C++ (10th Edition)
Thinking Like an Engineer: An Active Learning Approach (4th Edition)
Starting Out with Python (4th Edition)
Java How to Program, Early Objects (11th Edition) (Deitel: How to Program)
Starting Out with C++: Early Objects (9th Edition)
Starting Out with Java: From Control Structures through Objects (7th Edition) (What's New in Computer Science)


- Complete the JavaScript function addPixels () to calculate the sum of pixelAmount and the given element's cssProperty value, and return the new "px" value. Ex: If helloElem's width is 150px, then calling addPixels (hello Elem, "width", 50) should return 150px + 50px = "200px". SHOW EXPECTED HTML JavaScript 1 function addPixels (element, cssProperty, pixelAmount) { 2 3 /* Your solution goes here *1 4 } 5 6 const helloElem = document.querySelector("# helloMessage"); 7 const newVal = addPixels (helloElem, "width", 50); 8 helloElem.style.setProperty("width", newVal); [arrow_forwardSolve in MATLABarrow_forwardHello please look at the attached picture. I need an detailed explanation of the architecturearrow_forward
- Information Security Risk and Vulnerability Assessment 1- Which TCP/IP protocol is used to convert the IP address to the Mac address? Explain 2-What popular switch feature allows you to create communication boundaries between systems connected to the switch3- what types of vulnerability directly related to the programmer of the software?4- Who ensures the entity implements appropriate security controls to protect an asset? Please do not use AI and add refrencearrow_forwardFind the voltage V0 across the 4K resistor using the mesh method or nodal analysis. Note: I have already simulated it and the value it should give is -1.714Varrow_forwardResolver por superposicionarrow_forward
- Describe three (3) Multiplexing techniques common for fiber optic linksarrow_forwardCould you help me to know features of the following concepts: - commercial CA - memory integrity - WMI filterarrow_forwardBriefly describe the issues involved in using ATM technology in Local Area Networksarrow_forward
- For this question you will perform two levels of quicksort on an array containing these numbers: 59 41 61 73 43 57 50 13 96 88 42 77 27 95 32 89 In the first blank, enter the array contents after the top level partition. In the second blank, enter the array contents after one more partition of the left-hand subarray resulting from the first partition. In the third blank, enter the array contents after one more partition of the right-hand subarray resulting from the first partition. Print the numbers with a single space between them. Use the algorithm we covered in class, in which the first element of the subarray is the partition value. Question 1 options: Blank # 1 Blank # 2 Blank # 3arrow_forward1. Transform the E-R diagram into a set of relations. Country_of Agent ID Agent H Holds Is_Reponsible_for Consignment Number $ Value May Contain Consignment Transports Container Destination Ф R Goes Off Container Number Size Vessel Voyage Registry Vessel ID Voyage_ID Tonnagearrow_forwardI want to solve 13.2 using matlab please helparrow_forward
 C++ Programming: From Problem Analysis to Program...Computer ScienceISBN:9781337102087Author:D. S. MalikPublisher:Cengage Learning
 C++ for Engineers and ScientistsComputer ScienceISBN:9781133187844Author:Bronson, Gary J.Publisher:Course Technology Ptr
 Programming Logic & Design ComprehensiveComputer ScienceISBN:9781337669405Author:FARRELLPublisher:Cengage
 Microsoft Visual C#Computer ScienceISBN:9781337102100Author:Joyce, Farrell.Publisher:Cengage Learning,