
Videos
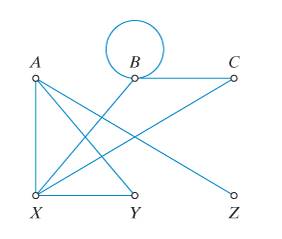
For the graph shown in Fig 5-29,
a. give the vertex set.
b. give the edge list.
c. give the degree of each vertex.
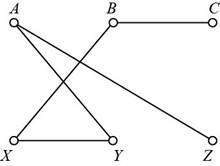
d. draw a version of the graph without crossing points.
(a)
To find:
The vertex set of given graph.
Answer to Problem 1E
Solution:
The vertex set is {A,B,C,X,Y,Z}.
Explanation of Solution
In the graphical representation of routes, the location is defined as a dot in the graph. Those dots are the vertices of the graph and the collection of vertices come under the vertex set.
Given:
The given graph is,
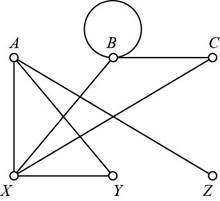
From the given graph, the vertices are A, B, C, X, Y and Z and the vertex set is {A,B,C,X,Y,Z}.
(b)
To find:
The edge list of given graph.
Answer to Problem 1E
Solution:
The list of edges is AX, AY, AZ, BB, BX, BC, CX and XY.
Explanation of Solution
Given:
In the graphical representation of routes, the paths or routes are defined by the lines in the graph. Those lines are the edges of the graph.
The given graph is,

From the given graph, the edges are AX, AY, AZ, BB, BX, BC, CX and XY.
(c)
To find:
The degree of each vertex in given graph.
Answer to Problem 1E
Solution:
The degree on vertices are deg(A)=3, deg(B)=4, deg(C)=2, deg(X)=4, deg(Y)=2 and deg(Z)=1.
Explanation of Solution
In the graph theory, the degree of any vertex is the number of edge formed on that particular vertex.
The count for a loop on any vertex is two degree on that vertex.
Given:
The given graph is,

From the given graph, the vertex A has 3 edges adjoined on it. The degree of vertex A is deg(A)=3.
The vertex B has 4 edges adjoined on it. The degree of vertex B is deg(B)=4.
The vertex C has 2 edges adjoined on it. The degree of vertex C is deg(C)=2.
The vertex X has 4 edges adjoined on it. The degree of vertex X is deg(X)=4.
The vertex Y has 2 edges adjoined on it. The degree of vertex Y is deg(Y)=2.
The vertex Z has 1 edge adjoined on it. The degree of vertex Z is deg(Z)=1.
Conclusion:
Thus, the degree on vertices are deg(A)=3, deg(B)=4, deg(C)=2, deg(X)=4, deg(Y)=2 and deg(Z)=1.
(d)
To plot:
The version of the graph without crossing points
Answer to Problem 1E
Solution:
The required graph is,
Explanation of Solution
Given:
The given graph is,

The required graph needs to have a route in which no vertex is taken again. From the given graph, the required graph is,

Want to see more full solutions like this?
Chapter 5 Solutions
Excursions in Modern Mathematics (9th Edition)
Additional Math Textbook Solutions
Pathways To Math Literacy (looseleaf)
Precalculus: Mathematics for Calculus (Standalone Book)
Precalculus
Beginning and Intermediate Algebra
Elementary Statistics ( 3rd International Edition ) Isbn:9781260092561
Algebra and Trigonometry (6th Edition)


- microsoft excel iclude fomulasarrow_forward7. In a 2011 article, M. Radelet and G. Pierce reported a logistic prediction equation for the death penalty verdicts in North Carolina. Let Y denote whether a subject convicted of murder received the death penalty (1=yes), for the defendant's race h (h1, black; h = 2, white), victim's race i (i = 1, black; i = 2, white), and number of additional factors j (j = 0, 1, 2). For the model logit[P(Y = 1)] = a + ß₁₂ + By + B²², they reported = -5.26, D â BD = 0, BD = 0.17, BY = 0, BY = 0.91, B = 0, B = 2.02, B = 3.98. (a) Estimate the probability of receiving the death penalty for the group most likely to receive it. [4 pts] (b) If, instead, parameters used constraints 3D = BY = 35 = 0, report the esti- mates. [3 pts] h (c) If, instead, parameters used constraints Σ₁ = Σ₁ BY = Σ; B = 0, report the estimates. [3 pts] Hint the probabilities, odds and odds ratios do not change with constraints.arrow_forwardf(x) 1/3 f(2(x-2))+4 (2,4) (-3,6) Please explain in step by step simple terms how to answer this questionarrow_forward
- Solve please and thank you!arrow_forwardSolve please and thank you!arrow_forwardPlease help step by step simple terms how to answer this question Given the parent function f(x)=1/x, determine the equation of the new function after the following transformations reflection over x and y axis vertical stretch by a factor of 6 horizontal compression by a factor of 1/3 translated 4 spaces left , 9 spaces up Clearly state the domain and rangearrow_forward
- Question 1:We want to evaluate the impact on the monetary economy for a company of two types of strategy (competitive strategy, cooperative strategy) adopted by buyers.Competitive strategy: strategy characterized by firm behavior aimed at obtaining concessions from the buyer.Cooperative strategy: a strategy based on a problem-solving negotiating attitude, with a high level of trust and cooperation.A random sample of 17 buyers took part in a negotiation experiment in which 9 buyers adopted the competitive strategy, and the other 8 the cooperative strategy. The savings obtained for each group of buyers are presented in the pdf that i sent: For this problem, we assume that the samples are random and come from two normal populations of unknown but equal variances.According to the theory, the average saving of buyers adopting a competitive strategy will be lower than that of buyers adopting a cooperative strategy.a) Specify the population identifications and the hypotheses H0 and H1…arrow_forwardGiven the following graph of the function y = f(x) and n = = 6, answer the following questions about the area under the curve from x graph to enlarge it.) 1 (Round your answer to within two decimal places if necessary, but do not round until your final computation.) a. Use the Trapezoidal Rule to estimate the area. Estimate: T6 G b. Use Simpson's Rule to estimate the area. Estimate: S6 - ID = 0 to x = 6. (Click on aarrow_forwardpls helparrow_forward
 Intermediate AlgebraAlgebraISBN:9781285195728Author:Jerome E. Kaufmann, Karen L. SchwittersPublisher:Cengage Learning
 Algebra & Trigonometry with Analytic GeometryAlgebraISBN:9781133382119Author:SwokowskiPublisher:Cengage
 College Algebra (MindTap Course List)AlgebraISBN:9781305652231Author:R. David Gustafson, Jeff HughesPublisher:Cengage Learning
 Trigonometry (MindTap Course List)TrigonometryISBN:9781337278461Author:Ron LarsonPublisher:Cengage Learning
 Algebra: Structure And Method, Book 1AlgebraISBN:9780395977224Author:Richard G. Brown, Mary P. Dolciani, Robert H. Sorgenfrey, William L. ColePublisher:McDougal Littell