The authors of the paper “Delayed Time to Defibrillation after In-Hospital Cardiac Arrest” (New England Journal of Medicine [2008]: 9–16) described a study of how survival is related to the length of time it takes from the time of a heart attack to the administration of defibrillation therapy. The following is a statement from the paper:
We identified 6789 patients from 369 hospitals who had in-hospital cardiac arrest due to ventricular fibrillation (69.7%) or pulseless ventricular trachycardia (30.3%). Overall, the
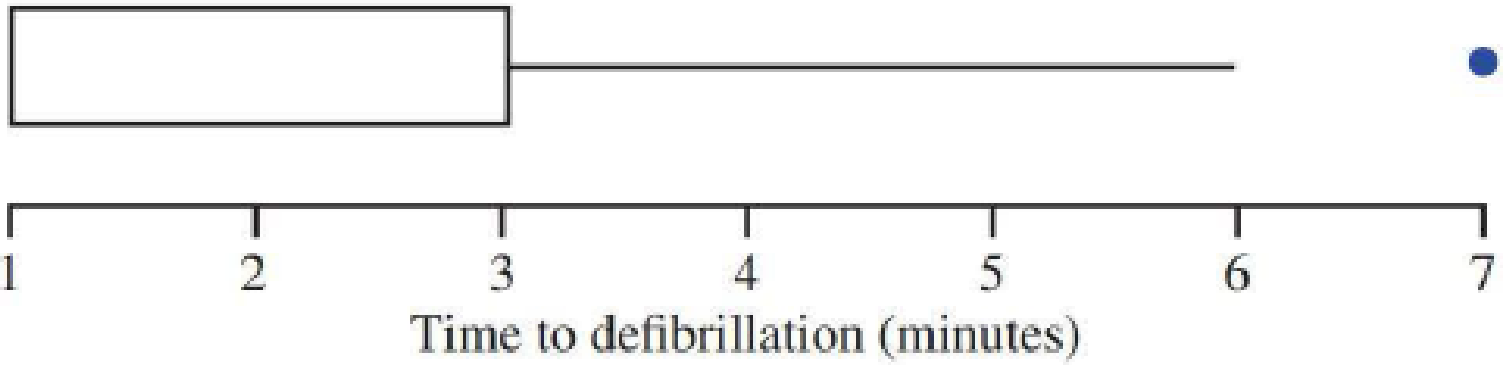
Data from the paper on time to defibrillation in minutes) for these 6789 patients was used to produce the Minitab output and boxplot at the bottom of the page.
- a. Why is there no lower whisker in the given boxplot?
- b. How is it possible for the median, the lower
quartile , and the minimum value in the data set to all be equal? (Note—this is why you do not see a median line in the box part of the boxplot.) - c. The authors of the paper considered a time to defibrillation of greater than 2 minutes as unacceptable. Based on the given boxplot and summary statistics, is it possible that the percentage of patients having an unacceptable time to defibrillation is greater than 50%? Greater than 25%? Less than 25%? Explain.
- d. Is the outlier shown at 7 a mild outlier or an extreme outlier?
Trending nowThis is a popular solution!
Chapter 4 Solutions
Introduction to Statistics and Data Analysis
Additional Math Textbook Solutions
Elementary Statistics (13th Edition)
Essential Statistics
Elementary Statistics: Picturing the World (6th Edition)
Statistical Reasoning for Everyday Life (5th Edition)
Statistics Through Applications
Statistics for Business & Economics, Revised (MindTap Course List)
- A study investigated the joint effects of sleep quality and sleep duration on the development of coronary heart disease (CHD). A total of 60,586 individuals aged 40 and older with no current or prior history of CHD were enrolled into the study. A self-administered questionnaire was used to collect information on sleep quality and duration at the start of the study, and 43,910 participants reported getting ³6 hours of sleep per day. Participants were followed for approximately 12 years, for a total of 152,000 person-years among those getting <6 hours sleep/day and 527,000 person-years among those getting ³6 hours sleep/day. Out of 2,740 participants who developed CHD throughout follow-up, 721 participants reported getting <6 hours of sleep per day at baseline. Question 10: What is the incidence rate of coronary heart disease among all participants in the study?arrow_forwardA recent study investigated the association between sudden cardiac death and smoking history in women from a large health system. The epidemiologist reviewed the electronic health records of women who died from sudden cardiac death (n=80) and women who died of non-cardiac causes (n=80). The investigator then reviewed these records for smoking history (smoking 1+ pack/day and smoking <1 pack/day) and identified the following results. Sudden Cardiac Death 38 42 Smoke 1+ pack/day Smoke <1 pack/day Calculate the most appropriate measure of association for these data (a)-round to the nearest tenth. Other Causes 10 70arrow_forwardWhen asked, "How much time will you require to complete this task?" cognitive theory posits that people will typically underestimate the time required. Would the opposite theory hold if the question was phrased in terms of how much work could be completed in a given amount of time? This was the question of interest to researchers writing in Applied Cognitive Psychology (Vol. 25, 2011). For one study conducted by the researchers, each in a sample of 40 University of Oslo students was asked how many minutes it would take to read a 32-page report. In a second study, 42 students were asked how many pages of a lengthy report they could read in 48 minutes. (The students in either study did not actually read the report.) Numerical descriptive statistics (based on summary information published in the article) for both studies are provided in the accompanying table. Sample size, n Sample mean, Sample standard deviation, s Estimated Time (minutes) 40 60 41 Estimated Number of Pages 42 28 14 a.…arrow_forward
- The article “The Effect of Restricting Opening Hours on Alcohol-Related Violence” (S. Duailibi, W. Ponicki, et al., American Journal of Public Health, 2007:2276–2280) presented homicide rates for the years 1995–2005 for the town of Diadema, Brazil. In 2002, a law was passed requiring bars to close at 11 pm each night. After the law's passage, the homicide rate dropped by an average of 9 homicides per month, a statistically significant decrease. Which of the following is the best conclusion? a) It is reasonable to conclude that the law is responsible for a reduction of 9 homicides per month. b) It is reasonable to conclude that the law is responsible for a reduction in homicides, but the actual amount might be somewhat more or less than 9 per month. c) It is reasonable to conclude that the homicide rate decreased, but the law may not have anything to do with the decrease. d) It is plausible that the homicide rate may not have decreased at all after the passage of the law.arrow_forwardColonoscopy is a medical procedure that is designed to find and remove precancerous lesions in the colon before they become cancerous. The article “Association of Colonoscopy and Death from Colorectal Cancer” (N. Baxter, M. Goldwasser, et al., Annals of Internal Medicine, 2009:1–8) reports that in a sample of 10,292 people diagnosed with colorectal cancer, 7.0% had previously had a colonoscopy, and in a sample of 51,460 people without colorectal cancer, 9.8% had previously had a colonoscopy. Can you conclude that the percentage of people who have had colonoscopies is greater in those without colorectal cancer?arrow_forwardResearchers have noted a decline in cognitive functioning as people age (Bartus, 1990). However, the results from other research suggest that the antioxidants in foods such as blueberries may reduce and even reverse these age-related declines (Joseph et al., 1999). To examine this phenomenon, suppose that a researcher obtains a sample of n = 16 adults who are between the ages of 65 and 75. The researcher uses a standardized test to measure cognitive performance for each individual. The participants then begin a 2-month program in which they receive daily doses of a blueberry supplement. At the end of the 2-month period, the researcher again measures cognitive performance for each participant. The results show an average increase in performance of Mp = 7.4 with SS = 1215. a. Does this result support the conclusion that the antioxidant supplement has a significant effect on cognitive performance? Use a two-tailed test with a = = .05. (1) Ho: (Select] ( Select ] [ Select ] H: ( Select ] […arrow_forward
- Researchers have noted a decline in cognitive functioning as people age (Bartus, 1990). However, the results from other research suggest that the antioxidants in foods such as blueberries may reduce and even reverse these age-related declines (Joseph et al., 1999). To examine this phenomenon, suppose that a researcher obtains a sample of n = 16 adults who are between the ages of 65 and 75. The researcher uses a standardized test to measure cognitive performance for each individual. The participants then begin a 2-month program in which they receive daily doses of a blueberry supplement. At the end of the 2-month period, the researcher again measures cognitive performance for each participant. The results show an average increase in performance of MD = 7.4 with SS = 1215. Does this result support the conclusion that the antioxidant supplement has a significant effect on cognitive performance? Use a two-tailed test with α = .05. Show your computations.arrow_forwardCheek teeth of extinct primates. The characteristics of cheek teeth (e.g., molars) can provide anthropologists with information on the dietary habits of extinct mammals. The cheek teeth of an extinct primate species were the subject of research reported in the American Journal of Physical Anthropology (Vol. 142, 2010). A total of 18 cheek teeth extracted from skulls discovered in western Wyoming were analyzed. Researchers recorded the dentary depth of molars (in millimeters) for a sample of 18 cheek teeth extracted from skulls. These depth measurements are listed in the accompanying table. Anthropologists know that the mean dentary depth of molars in an extinct primate species— called Species A—is 15 millimeters. Is there evidence to indicate that the sample of 18 cheek teeth come from some other extinct primate species (i.e., some species other than Species A)? The data are given below (you will need to put it into a single column). You will need to calculate the sample…arrow_forward1. Does the herb Echinacea help the common cold? A study investigated the impact of echinacea vs. a standard cold medication on cold symptoms. Each subject in the study chose to take either the echinacea or a standard cold medication in capsule form After taking the capsule for one week, the subjects then reported to the researchers the status of their cold symptoms. The researchers subsequently reported that there was no statistically significant difference in the duration of the cold between these groups. The variable duration of cold in this study would be the a) Explanatory variable b) Response variable c) Population d) Statisticarrow_forward
- You may need to use the appropriate appendix table or technology to answer this question. Approximately 50% of all caregivers of older adults are caring for someone with memory loss (due to is percentage of caregivers caring for older adults with memory loss. This year, in a random sample of 400 caregivers, 181 were caring for older adults with memory loss uch as Alaheimer's or dementia). It is beleved that there has been a reduction in the (a) State the null and the alternative hypotheses. (Enter t for as needed.) (b) At the 0.05 level using the critical value approach, determine if there has been a significant reduction in the proportion of caregivers caring for adults with memory loss Compute the test statistk. Determine the critical value(s) for this test. (Round your answerta) to two decimal places. If the test is one-taled, enter NONE for the unused tal.) test statisticS test statistic State your condusion. O Reject Ha There is insufficient evidence to support the claim that the…arrow_forwardThe paper "Breast MRI as an Adjunct to Mammography for Breast Cancer Screening in High-Risk Patients" describes a study that investigated the usefulness of MRI (magnetic resonance imaging) to diagnose breast cancer. MRI exams from 650 women were reviewed. Of the 650 women, 13 had breast cancer, and the MRI exam detected breast cancer in 12 of these women. Of the 637 women who did not have breast cancer, the MRI correctly identified that no cancer was present for 547 of them. The accompanying table summarizes this information. Breast CancerPresent Breast CancerNot Present Total MRI IndicatedBreast Cancer 12 90 102 MRI Did NotIndicate Breast Cancer 1 547 548 Total 13 637 650 Suppose that an MRI exam is used to decide between the two hypotheses. H0: A woman does not have breast cancer. Ha: A woman has breast cancer. (Although these are not hypotheses about a population characteristic, this exercise illustrates the definitions of Type I and Type II errors.) a. One…arrow_forwardThe paper "Breast MRI as an Adjunct to Mammography for Breast Cancer Screening in High-Risk Patients" describes a study that investigated the usefulness of MRI (magnetic resonance imaging) to diagnose breast cancer. MRI exams from 650 women were reviewed. Of the 650 women, 13 had breast cancer, and the MRI exam detected breast cancer in 12 of these women. Of the 637 women who did not have breast cancer, the MRI correctly identified that no cancer was present for 547 of them. The accompanying table summarizes this information. † Breast CancerPresent Breast CancerNot Present Total MRI IndicatedBreast Cancer 12 90 102 MRI Did NotIndicate Breast Cancer 1 547 548 Total 13 637 650 a. Use the information in the table to approximate the probability of this type of error. (Hint: See Example 10.8. Enter your probability as a decimal) b. Use the information in the table to approximate the probability of this type of error. (Enter your probability as a decimal )arrow_forward
- Linear Algebra: A Modern IntroductionAlgebraISBN:9781285463247Author:David PoolePublisher:Cengage LearningHolt Mcdougal Larson Pre-algebra: Student Edition...AlgebraISBN:9780547587776Author:HOLT MCDOUGALPublisher:HOLT MCDOUGALGlencoe Algebra 1, Student Edition, 9780079039897...AlgebraISBN:9780079039897Author:CarterPublisher:McGraw Hill