
Concept explainers
Videos
a.
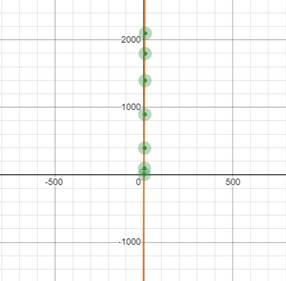
To write:An equation of line of best fit for given data and to further graph the points and plot the line.
a.
Answer to Problem 17E
Equation of line of best fit is
Explanation of Solution
Given Information: Data values of minutes,
Calculation:
Entering the data and using the linear regression feature in the graphing calculator,
As
thus, equation of line of best fit is
Graph:
b.
To identify:The
b.
Answer to Problem 17E
Data values have strong
Explanation of Solution
Given information:Graphing calculator display from the previous part.
Interpretation:
From the graphing calculator display in the previous part, it can be inferred that
c.
To interpret:The slope and
c.
Answer to Problem 17E
Slope is positive and is 381.
Line of best fit crosses the
Explanation of Solution
Given Information:Graphing calculator display from previous part.
Interpretation:
From the graphing calculator display shown in part
It interprets that number of reports might increase by 381 per minute after the earthquake ended.
Chapter 4 Solutions
Big Ideas Math A Bridge To Success Algebra 1: Student Edition 2015


 Algebra and Trigonometry (6th Edition)AlgebraISBN:9780134463216Author:Robert F. BlitzerPublisher:PEARSON
 Contemporary Abstract AlgebraAlgebraISBN:9781305657960Author:Joseph GallianPublisher:Cengage Learning
 Linear Algebra: A Modern IntroductionAlgebraISBN:9781285463247Author:David PoolePublisher:Cengage Learning
 Algebra And Trigonometry (11th Edition)AlgebraISBN:9780135163078Author:Michael SullivanPublisher:PEARSON
 Introduction to Linear Algebra, Fifth EditionAlgebraISBN:9780980232776Author:Gilbert StrangPublisher:Wellesley-Cambridge Press
 College Algebra (Collegiate Math)AlgebraISBN:9780077836344Author:Julie Miller, Donna GerkenPublisher:McGraw-Hill Education