
Concept explainers
Videos
(a)
To find: The equation of the best line fit with the help of graphing calculator.
(a)
Answer to Problem 11CT
The equation for the best fit line is
Explanation of Solution
Given:
The given table is shown in Table 1
Table 1
| Advertising (dollars )x | Yearly attendance, y |
| 500 | 400 |
| 1000 | 550 |
| 1500 | 550 |
| 2000 | 800 |
| 2500 | 650 |
| 3000 | 800 |
| 3500 | 1050 |
| 4000 | 1100 |
Calculation:
Input the values shown in Table 1 in the calculator and the result obtained is shown in Figure 1
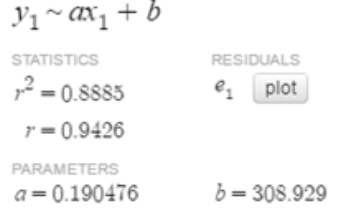
Figure 1
Thus, the equation for the best fit line is
(b)
To find: The interpretation for the
(b)
Answer to Problem 11CT
The value of
Explanation of Solution
Given:
The given table is shown in Table 1
Table 1
| Advertising (dollars )x | Yearly attendance, y |
| 500 | 400 |
| 1000 | 550 |
| 1500 | 550 |
| 2000 | 800 |
| 2500 | 650 |
| 3000 | 800 |
| 3500 | 1050 |
| 4000 | 1100 |
Calculation:
From part (a) the correlation coefficient obtained is 0.9426. The value is close to 1 that means that the linear model is the good fit.
(c)
To find: The expectation for the
(c)
Answer to Problem 11CT
The scatter plot is supposed to be evenly dispersed about the horizontal axis.
Explanation of Solution
Given:
The given table is shown in Table 1
Table 1
| Advertising (dollars )x | Yearly attendance, y |
| 500 | 400 |
| 1000 | 550 |
| 1500 | 550 |
| 2000 | 800 |
| 2500 | 650 |
| 3000 | 800 |
| 3500 | 1050 |
| 4000 | 1100 |
Calculation:
From the value of the correlation the model is the good fit and being a good fit the expected scatter plot must be evenly dispersed about the horizontal axis.
(d)
To find: Whether there is any causal relationship in the data.
(d)
Answer to Problem 11CT
The number of people attending is proportional to the number of people viewing the advertisement.
Explanation of Solution
Given:
The given table is shown in Table 1
Table 1
| Advertising (dollars )x | Yearly attendance, y |
| 500 | 400 |
| 1000 | 550 |
| 1500 | 550 |
| 2000 | 800 |
| 2500 | 650 |
| 3000 | 800 |
| 3500 | 1050 |
| 4000 | 1100 |
Calculation:
From the given data shown in Table 1 the casual relationship that arise is that, more the number of people know about the advertisement the more they attend the festival.
Thus, the number of people attending is proportional to the number of people viewing the advertisement.
(e)
To find: The prediction for the amount that must be spent on the advertising to get 2000 people to attend the festival.
(e)
Answer to Problem 11CT
The amount that must be spent is
Explanation of Solution
Given:
The given table is shown in Table 1
Table 1
| Advertising (dollars )x | Yearly attendance, y |
| 500 | 400 |
| 1000 | 550 |
| 1500 | 550 |
| 2000 | 800 |
| 2500 | 650 |
| 3000 | 800 |
| 3500 | 1050 |
| 4000 | 1100 |
Calculation:
From the given data, consider the equation for the best fit is
Then,
Thus, the amount that must be spent is
Chapter 4 Solutions
Big Ideas Math A Bridge To Success Algebra 1: Student Edition 2015


- 1. Given that h(t) = -5t + 3 t². A tangent line H to the function h(t) passes through the point (-7, B). a. Determine the value of ẞ. b. Derive an expression to represent the gradient of the tangent line H that is passing through the point (-7. B). c. Hence, derive the straight-line equation of the tangent line H 2. The function p(q) has factors of (q − 3) (2q + 5) (q) for the interval -3≤ q≤ 4. a. Derive an expression for the function p(q). b. Determine the stationary point(s) of the function p(q) c. Classify the stationary point(s) from part b. above. d. Identify the local maximum of the function p(q). e. Identify the global minimum for the function p(q). 3. Given that m(q) = -3e-24-169 +9 (-39-7)(-In (30-755 a. State all the possible rules that should be used to differentiate the function m(q). Next to the rule that has been stated, write the expression(s) of the function m(q) for which that rule will be applied. b. Determine the derivative of m(q)arrow_forwardSafari File Edit View History Bookmarks Window Help Ο Ω OV O mA 0 mW ర Fri Apr 4 1 222 tv A F9 F10 DII 4 F6 F7 F8 7 29 8 00 W E R T Y U S D பட 9 O G H J K E F11 + 11 F12 O P } [arrow_forwardSo confused. Step by step instructions pleasearrow_forward
- In simplest terms, Sketch the graph of the parabola. Then, determine its equation. opens downward, vertex is (- 4, 7), passes through point (0, - 39)arrow_forwardIn simplest way, For each quadratic relation, find the zeros and the maximum or minimum. a) y = x 2 + 16 x + 39 b) y = 5 x2 - 50 x - 120arrow_forwardIn simplest terms and step by step Write each quadratic relation in standard form, then fi nd the zeros. y = - 4( x + 6)2 + 36arrow_forward
- In simplest terms and step by step For each quadratic relation, find the zeros and the maximum or minimum. 1) y = - 2 x2 - 28 x + 64 2) y = 6 x2 + 36 x - 42arrow_forwardWrite each relation in standard form a)y = 5(x + 10)2 + 7 b)y = 9(x - 8)2 - 4arrow_forwardIn simplest form and step by step Write the quadratic relation in standard form, then fi nd the zeros. y = 3(x - 1)2 - 147arrow_forward
- Step by step instructions The path of a soccer ball can be modelled by the relation h = - 0.1 d 2 + 0.5 d + 0.6, where h is the ball’s height and d is the horizontal distance from the kicker. a) Find the zeros of the relation.arrow_forwardIn simplest terms and step by step how do you find the zeros of y = 6x2 + 24x - 192arrow_forwardStep by step Find the zeros of each quadratic relation. a) y = x2 - 16xarrow_forward
 Algebra and Trigonometry (6th Edition)AlgebraISBN:9780134463216Author:Robert F. BlitzerPublisher:PEARSON
 Contemporary Abstract AlgebraAlgebraISBN:9781305657960Author:Joseph GallianPublisher:Cengage Learning
 Linear Algebra: A Modern IntroductionAlgebraISBN:9781285463247Author:David PoolePublisher:Cengage Learning
 Algebra And Trigonometry (11th Edition)AlgebraISBN:9780135163078Author:Michael SullivanPublisher:PEARSON
 Introduction to Linear Algebra, Fifth EditionAlgebraISBN:9780980232776Author:Gilbert StrangPublisher:Wellesley-Cambridge Press
 College Algebra (Collegiate Math)AlgebraISBN:9780077836344Author:Julie Miller, Donna GerkenPublisher:McGraw-Hill Education