
Concept explainers
Videos
A cylindrical hole is drilled in a block, and a cylindrical piston is placed in the hole. The clearance is equal to one-half the difference between the diameters of the hole and the piston. The diameter of the hole is
- a. Find the mean clearance.
- b. Find the standard deviation of the clearance.
- c. What is the
probability that the clearance is less than 0.05 cm? - d. Find the 25th percentile of the clearance.
- e. Specifications call for the clearance to be between 0.05 and 0.09 cm. What is the probability that the clearance meets the specification?
- f. It is possible to adjust the mean hole diameter. To what value should it be adjusted so as to maximize the probability that the clearance will be between 0.05 and 0.09 cm?
a.
Determine the mean clearance.
Answer to Problem 13E
The mean clearance is 0.06 cm.
Explanation of Solution
Given info:
The diameter of the hole is normally distributed with mean
Calculation:
The random variable X is defined as the diameter of a hole and the random variable Y as the diameter of a piston. Then X follows Normal with parameters
The clearance is denoted as C and is defined as
The mean clearance is,
Thus, the mean clearance is 0.06 cm.
b.
Determine the standard deviation of the clearance.
Answer to Problem 13E
The standard deviation of the clearance is 0.01458 cm.
Explanation of Solution
Calculation:
The standard deviation of the clearance is,
Thus, the standard deviation of the clearance is 0.01458 cm.
c.
Find the probability that the clearance is less than 0.05.
Answer to Problem 13E
The probability of clearance less than 0.05 is
Explanation of Solution
Calculation:
The random variable C is a linear combination of two normal random variables. Then C follows normal with mean
The required probability is,
The formula to convert X values into z score is,
Substitute 0.06 for
The above probability can be obtained by finding the areas to the left of –0.69.
The shaded region represents the area to the left of –0.69 is shown below:
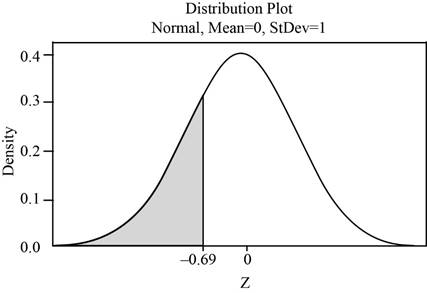
Use Table A.2: Cumulative Normal Distribution to find the area.
Procedure:
For probability value for
- Locate –0.6 in the left column of the Table A.2.
- Obtain the value in the corresponding to the row below 0.09.
- The required value is 0.2451.
That is,
Then,
Thus, the value of
d.
Find the value of 25th percentile of the clearance.
Answer to Problem 13E
The value of 25th percentile of the clearance is 0.0502 cm.
Explanation of Solution
Calculation:
The 25th percentile is denoted as
The 25th percentile of a random variable C is defined as
The value of the random variable C for the bottom 0.25 is same as the value of C for the top 0.75. The area to the left of Z is 0.25 and right of Z is 0.75.
The shaded region represents of the area 25th percentile of a normal random variable is shown below:
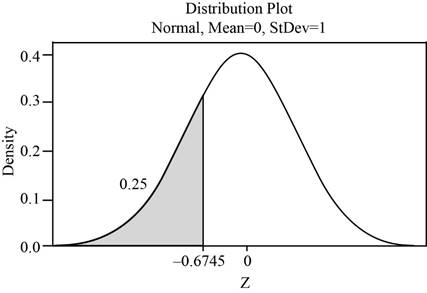
Use Table A.2: Cumulative Normal Distribution to find the critical value.
Procedure:
- Locate an approximate area of 0.2500 in the body of the A.2 table. The area closest to 0.2500 is 0.2514.
- Move left until the first column and note the value as –0.6.
- Move upward until the top row reached and note the value as 0.07.
Thus, the corresponding z-score is –0.67.
Therefore, the 25th percentile for the random variable C is,
Thus, the 25th percentile of the clearance is 0.0502 cm.
e.
Find the probability that the clearance to be between 0.05 cm and 0.09 cm.
Answer to Problem 13E
The probability that the clearance to be between 0.05 cm and 0.09 cm is 0.7352.
Explanation of Solution
Calculation:
The probability that the clearance to be between 0.05 cm and 0.09 cm implies that
Substitute 0.06 for
The value of
The shaded region represents the area between
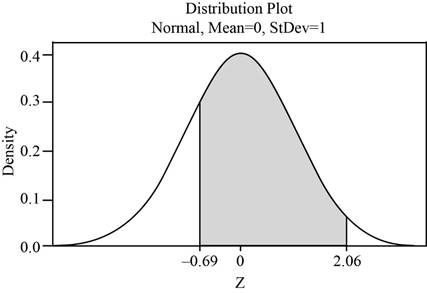
The area under the standard normal curve that lies between
Use Table A.2: Cumulative Normal Distribution to find the areas.
Procedure:
For z at 2.06,
- Locate 2.0 in the left column of the Table A.2.
- Obtain the value in the corresponding row below 0.06.
That is,
For z at –0.69,
- Locate –0.6 in the left column of the Table A.2.
- Obtain the value in the corresponding row below 0.06.
That is,
Thus,
Thus, the area under the normal curves between
f.
Find the value of adjusted mean hole diameter so as to maximize the probability that the clearance to be between 0.05 cm and 0.09 cm.
Answer to Problem 13E
The value of adjusted mean hole diameter has to be adjusted to 15.2cm to maximize the probability that the clearance to be between 0.05 cm and 0.09.
Explanation of Solution
Calculation:
The probability is maximized at the midpoint between 0.05 cm and 0.09 cm.
The midpoint is
That is, the probability is maximized at
The mean diameter of the piston is,
Then, the adjusted mean hole diameter must satisfies the following equation,
Substitute
On solving,
Thus, the adjusted mean hole diameter is 15.02 cm.
The probability that the clearance to be between 0.05 cm and 0.09 cm implies that
Substitute 0.07 for
The value of
The shaded region represents the area between
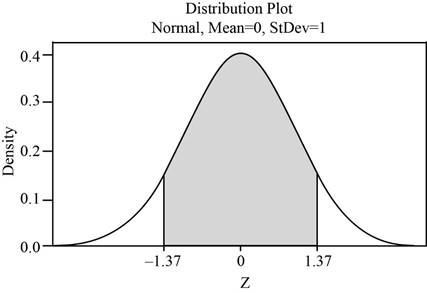
The area under the standard normal curve that lies between
Use Table A.2: Cumulative Normal Distribution to find the areas.
Procedure:
For z at 1.37,
- Locate 1.3 in the left column of the Table A.2.
- Obtain the value in the corresponding row below 0.07.
That is,
For z at –1.37,
- Locate –1.3 in the left column of the Table A.2.
- Obtain the value in the corresponding row below 0.07.
That is,
Thus,
Thus, the area under the normal curves between
Thus, the probability of the clearance to be between 0.05 cm and 0.09 cm is maximized when the mean clearance becomes 0.07.
Therefore, the value of adjusted mean hole diameter has to be adjusted to 15.2cm to maximize the probability that the clearance to be between 0.05 cm and 0.09.
Want to see more full solutions like this?
Chapter 4 Solutions
Statistics for Engineers and Scientists


- A marketing agency wants to determine whether different advertising platforms generate significantly different levels of customer engagement. The agency measures the average number of daily clicks on ads for three platforms: Social Media, Search Engines, and Email Campaigns. The agency collects data on daily clicks for each platform over a 10-day period and wants to test whether there is a statistically significant difference in the mean number of daily clicks among these platforms. Conduct ANOVA test. You can provide your answer by inserting a text box and the answer must include: also please provide a step by on getting the answers in excel Null hypothesis, Alternative hypothesis, Show answer (output table/summary table), and Conclusion based on the P value.arrow_forwardA company found that the daily sales revenue of its flagship product follows a normal distribution with a mean of $4500 and a standard deviation of $450. The company defines a "high-sales day" that is, any day with sales exceeding $4800. please provide a step by step on how to get the answers Q: What percentage of days can the company expect to have "high-sales days" or sales greater than $4800? Q: What is the sales revenue threshold for the bottom 10% of days? (please note that 10% refers to the probability/area under bell curve towards the lower tail of bell curve) Provide answers in the yellow cellsarrow_forwardBusiness Discussarrow_forward
- The following data represent total ventilation measured in liters of air per minute per square meter of body area for two independent (and randomly chosen) samples. Analyze these data using the appropriate non-parametric hypothesis testarrow_forwardeach column represents before & after measurements on the same individual. Analyze with the appropriate non-parametric hypothesis test for a paired design.arrow_forwardShould you be confident in applying your regression equation to estimate the heart rate of a python at 35°C? Why or why not?arrow_forward
 Big Ideas Math A Bridge To Success Algebra 1: Stu...AlgebraISBN:9781680331141Author:HOUGHTON MIFFLIN HARCOURTPublisher:Houghton Mifflin Harcourt
 Glencoe Algebra 1, Student Edition, 9780079039897...AlgebraISBN:9780079039897Author:CarterPublisher:McGraw Hill
 College Algebra (MindTap Course List)AlgebraISBN:9781305652231Author:R. David Gustafson, Jeff HughesPublisher:Cengage Learning