
Concept explainers
Videos
a.
The relationship between dependent and independent variable and make a scatter-plot for the given data set.
a.
Answer to Problem 3CYU
The independent variable is the number of years and dependent variable is the median age of females when they are first married. There is
Explanation of Solution
Given: The given data between the number of years and median age of females when they are first married is shown as
| Number of years | Median age of females |
| 1996 | 24.8 |
| 1997 | 25.0 |
| 1998 | 25.0 |
| 1999 | 25.1 |
| 2000 | 25.1 |
| 2001 | 25.1 |
| 2002 | 25.3 |
| 2003 | 25.3 |
| 2005 | 25.5 |
| 2006 | 25.9 |
Graph: The graph for the scatter-plot is shown as,
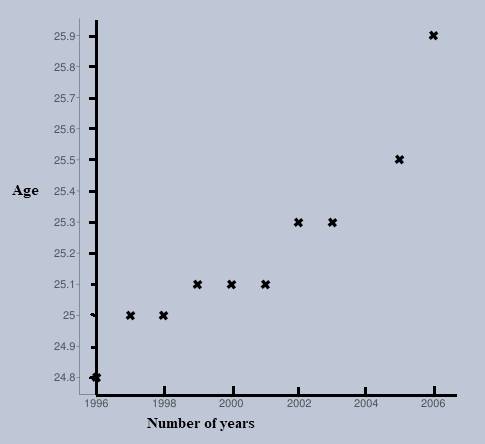
Conclusion: As the number of years increases, the age also increases. Therefore, there is a positive
b.
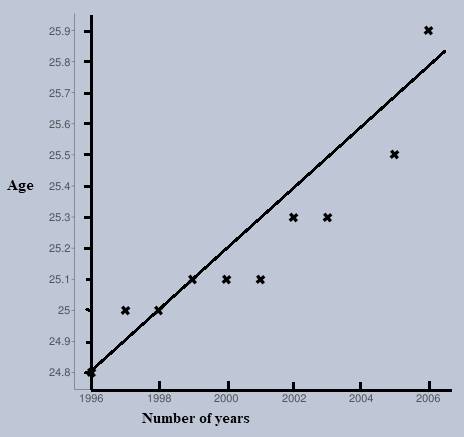
The graph of line of fit for the
b.
Explanation of Solution
Given: The given data between the number of years and median age of females when they are first married is shown as
| Number of years | Median age of females |
| 1996 | 24.8 |
| 1997 | 25.0 |
| 1998 | 25.0 |
| 1999 | 25.1 |
| 2000 | 25.1 |
| 2001 | 25.1 |
| 2002 | 25.3 |
| 2003 | 25.3 |
| 2005 | 25.5 |
| 2006 | 25.9 |
Graph: The line of fit for the scatter-plot is shown as, where number of years are represented on horizontal axis and median age of females is represented on vertical line.
c.
The equation for line of fit in slope intercept form.
c.
Answer to Problem 3CYU
The equation for the line of fit is
Explanation of Solution
Given: The given data between the number of years and median age of females when they are first married is shown as
| Number of years | Median age of females |
| 1996 | 24.8 |
| 1997 | 25.0 |
| 1998 | 25.0 |
| 1999 | 25.1 |
| 2000 | 25.1 |
| 2001 | 25.1 |
| 2002 | 25.3 |
| 2003 | 25.3 |
| 2005 | 25.5 |
| 2006 | 25.9 |
Calculation: The slope
Now, the line of fit having slope
d.
The median age of females when they are first married in 2016.
d.
Answer to Problem 3CYU
The median age of females will be 27 years.
Explanation of Solution
Given: The given data between the number of years and median age of females when they are first married is shown as
| Number of years | Median age of females |
| 1996 | 24.8 |
| 1997 | 25.0 |
| 1998 | 25.0 |
| 1999 | 25.1 |
| 2000 | 25.1 |
| 2001 | 25.1 |
| 2002 | 25.3 |
| 2003 | 25.3 |
| 2005 | 25.5 |
| 2006 | 25.9 |
Calculation: The median age of females in 2016 can be evaluated by plugging
e.
Can the equation of fit give the reasonable estimate for the year 2056? Explain.
e.
Answer to Problem 3CYU
Yes, the equation gives the reasonable estimate for the year 2056 because for the year 2056 the estimated age is 31.4 years.
Explanation of Solution
Given: The given data between the number of years and median age of females when they are first married is shown as
| Number of years | Median age of females |
| 1996 | 24.8 |
| 1997 | 25.0 |
| 1998 | 25.0 |
| 1999 | 25.1 |
| 2000 | 25.1 |
| 2001 | 25.1 |
| 2002 | 25.3 |
| 2003 | 25.3 |
| 2005 | 25.5 |
| 2006 | 25.9 |
Calculation: The median age of females in 2056 can be evaluated by plugging
Hence, the equation of fit gives a reasonable estimate for the year 2056 because in the year 2056 the predicted age of women comes 31.4 years.
Chapter 4 Solutions
Glencoe Algebra 1, Student Edition, 9780079039897, 0079039898, 2018
Additional Math Textbook Solutions
Pre-Algebra Student Edition
Elementary Statistics: Picturing the World (7th Edition)
A Problem Solving Approach To Mathematics For Elementary School Teachers (13th Edition)
Thinking Mathematically (6th Edition)
University Calculus: Early Transcendentals (4th Edition)
Elementary Statistics (13th Edition)


- Safari File Edit View History Bookmarks Window Help Ο Ω OV O mA 0 mW ర Fri Apr 4 1 222 tv A F9 F10 DII 4 F6 F7 F8 7 29 8 00 W E R T Y U S D பட 9 O G H J K E F11 + 11 F12 O P } [arrow_forwardSo confused. Step by step instructions pleasearrow_forwardIn simplest terms, Sketch the graph of the parabola. Then, determine its equation. opens downward, vertex is (- 4, 7), passes through point (0, - 39)arrow_forward
- In simplest way, For each quadratic relation, find the zeros and the maximum or minimum. a) y = x 2 + 16 x + 39 b) y = 5 x2 - 50 x - 120arrow_forwardIn simplest terms and step by step Write each quadratic relation in standard form, then fi nd the zeros. y = - 4( x + 6)2 + 36arrow_forwardIn simplest terms and step by step For each quadratic relation, find the zeros and the maximum or minimum. 1) y = - 2 x2 - 28 x + 64 2) y = 6 x2 + 36 x - 42arrow_forward
- Write each relation in standard form a)y = 5(x + 10)2 + 7 b)y = 9(x - 8)2 - 4arrow_forwardIn simplest form and step by step Write the quadratic relation in standard form, then fi nd the zeros. y = 3(x - 1)2 - 147arrow_forwardStep by step instructions The path of a soccer ball can be modelled by the relation h = - 0.1 d 2 + 0.5 d + 0.6, where h is the ball’s height and d is the horizontal distance from the kicker. a) Find the zeros of the relation.arrow_forward
 Algebra and Trigonometry (6th Edition)AlgebraISBN:9780134463216Author:Robert F. BlitzerPublisher:PEARSON
 Contemporary Abstract AlgebraAlgebraISBN:9781305657960Author:Joseph GallianPublisher:Cengage Learning
 Linear Algebra: A Modern IntroductionAlgebraISBN:9781285463247Author:David PoolePublisher:Cengage Learning
 Algebra And Trigonometry (11th Edition)AlgebraISBN:9780135163078Author:Michael SullivanPublisher:PEARSON
 Introduction to Linear Algebra, Fifth EditionAlgebraISBN:9780980232776Author:Gilbert StrangPublisher:Wellesley-Cambridge Press
 College Algebra (Collegiate Math)AlgebraISBN:9780077836344Author:Julie Miller, Donna GerkenPublisher:McGraw-Hill Education